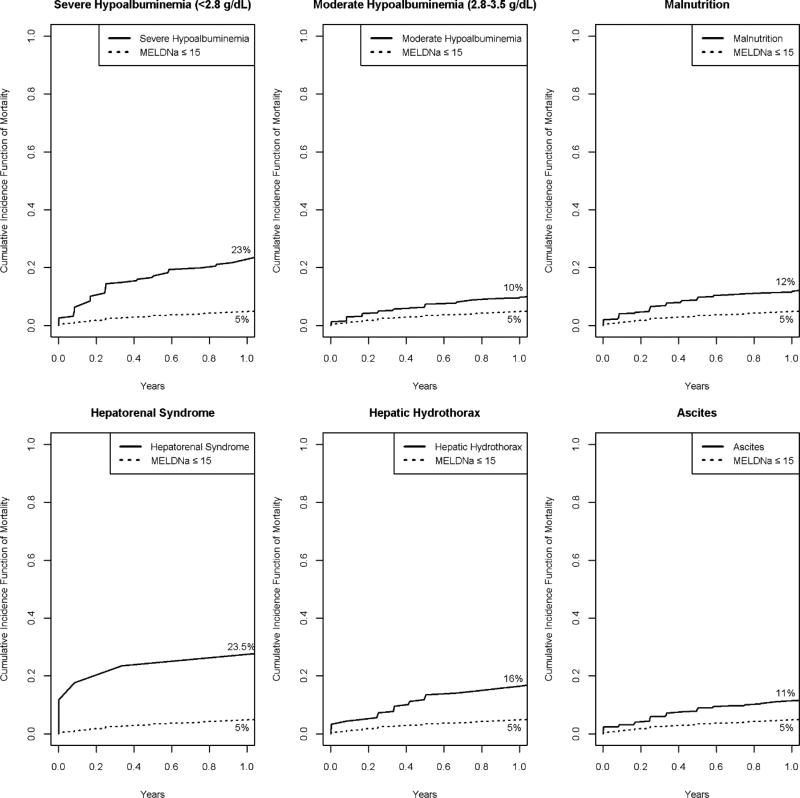
Figure 4. *. Cumulative Incidence Function of Mortality plots showing 1 year predicted mortality among patients in Low-MELDNa cohort according to specific risk factor.
*Risk factors included are those obtained from the multivariate subdistribution hazard model figure 2.
The figure demonstrates 1 year predicted mortality accounting for liver transplantation as a competing risk among patients with Low-MELDNa according to specific risk factor. The dotted line represents the curve for all patients with MELDNa≤15. Solid line represent the curve for patients with MELDNa≤15 and specific risk factor of cirrhosis.
Abbrev: g/dl: gram per deciliter, MELDNa: Model for end-stage liver disease sodium

