
Fig. 5.
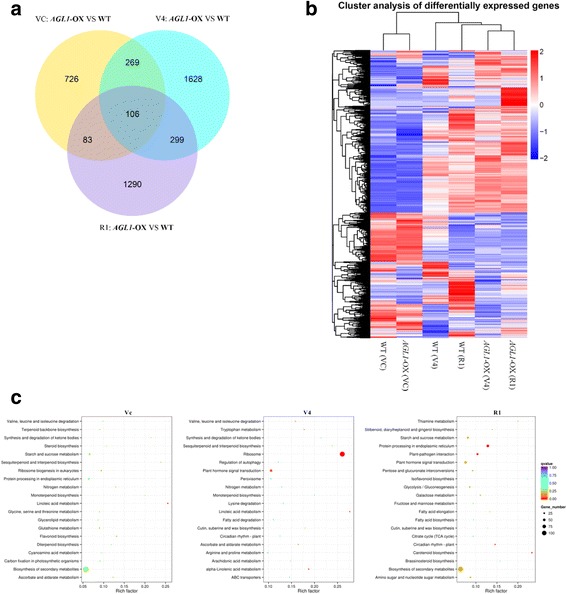
Transcriptome sequencing and cluster analysis of differentially expressed genes. a Venn diagram showing the number of DEGs between AGL1-OX transgenic and WT plants in the VC, V4 and R1 stages. b Heat cluster of DEGs between AGL1-OX transgenic and WT plants in the VC, V4 and R1 stages. c Scatterplot showing the most enriched KEGG pathways of DEGs between AGL1-OX transgenic and WT plants in the VC, V4 and R1 stages. The Y-axis shows the most enriched KEGG pathways, and the X-axis shows the enrichment factor. The sizes of the plots indicate the number of DEGs in the pathway, and the colours of the plots indicate the Q-value of each pathway