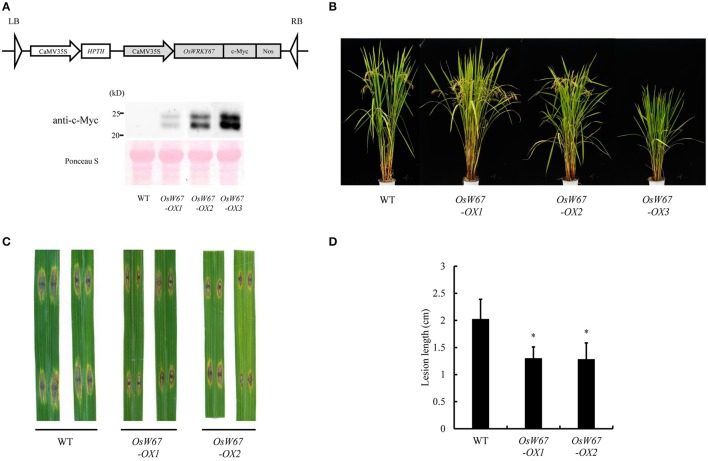
Figure 3.
Disease resistance phenotype of OsWRKY67 overexpression lines. (A) Schematic representation of the OsWRKY67 overexpression construct (Top). Western blot analysis using the anti-c-Myc antibody to examine OsWRKY67 protein (Bottom). Ponceau S staining was used as the loading control. (B) Growth phenotype of OsWRKY67 overexpression lines. Rice plants were grown in a paddy field and photographed at the ripening stage. WT is a wild type control cultivar, Dongjin. (C) Representative leaves 9 days after inoculation with M. oryzae PO6-6. (D) Disease lesion lengths measured 9 days after inoculation with M. oryzae PO6-6. Data are represented as means ± SD. Asterisks represent statistical significance with Student's t-test, p < 0.0001.

