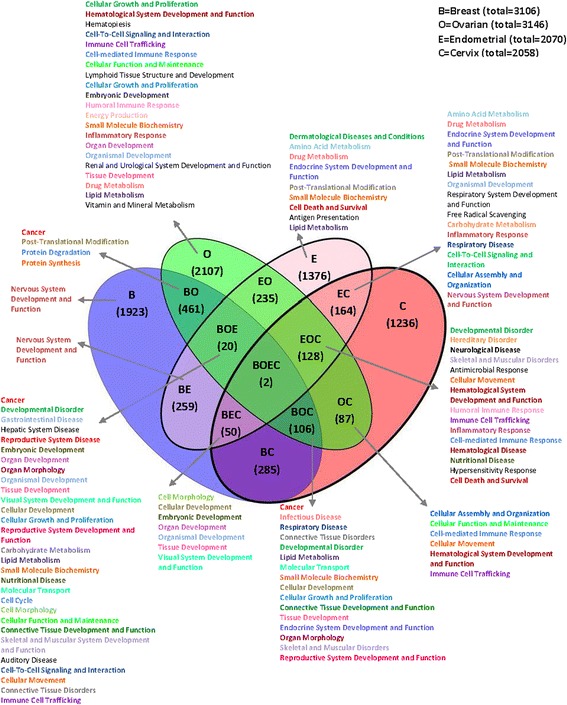
Fig. 4.

Overlap between gene sets of four female cancer– Top biological functions. The Venn diagram displays joint genes identified by both, CBS and PCF algorithms located within the regions identified by GISTIC. The total number of genes for each data set is presented on the top right panel. Top biological functions and top canonical pathways for each region of the overlapped cancers are stated
