Fig. 4.
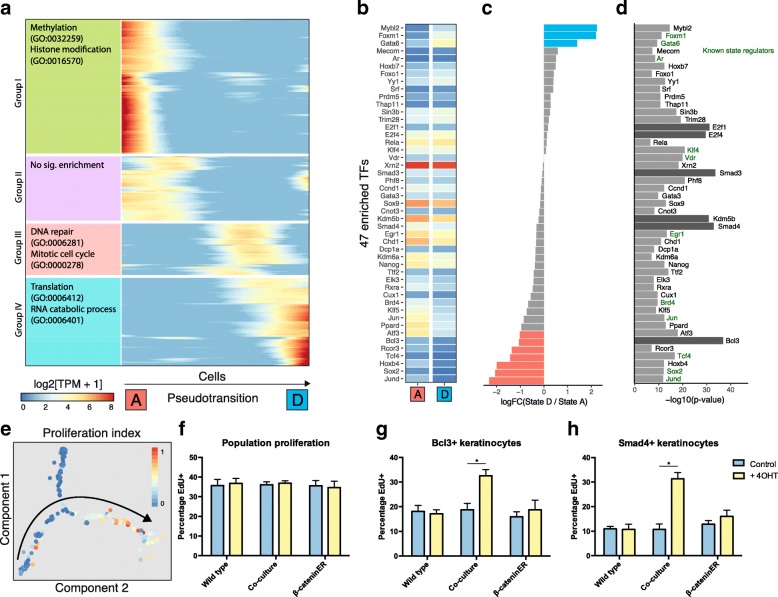
Induction of proliferation in Wnt + neighbours is regulated by 47 TFs. a Heatmap showing smoothed expression of pseudotransition-dependent genes (n = 632) ordered by hierarchical clustering and maximum expression. Top two enriched GO terms shown on left (all significant at q < 0.05). Genes (rows) are ordered by peak expression from state A to state D. b–d Heatmap showing expression of 47 TFs enriched as regulators of pseudotransition-dependent genes (b). Log-fold change in expression of TFs between state D and state A to show strongly directional TFs (c) and enrichment level of TFs (d). e Normalised proliferation index projected onto the cell state map. Arrow denotes the direction of pseudotransition. f–h Quantification of population proliferation by EdU assay in WT, K14ΔNβ-cateninER and co-cultured keratinocytes with and without 4OHT treatment (f). After stratification by Bcl3 nuclear abundance, cells in co-culture with activated K14ΔNβ-cateninER cells show a relative higher proliferation rate (g). Similarly, stratification by nuclear Smad4 shows higher proliferation in the treated co-culture condition (h) (n = 3 independent cultures). *P < 0.05. All data shown as mean ± SD

