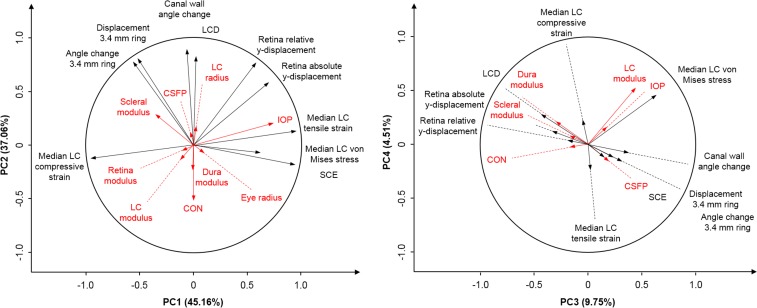
Figure 3.
Biplots of the top four principal components (PCs). Left: PC1 and PC2; right: PC3 and PC4. The top four PCs accounted for over 96% of the total variance. A biplot shows two-dimensional projections of the responses (black lines) and factors (red lines). The angle between lines represents the strength of the correlation between variables. Strongly correlated variables are parallel (0°) or antiparallel (180°), and independent variables are orthogonal (90°). All lines have a length of 1 in a 98-dimensional space. Line length in a biplot is the variance accounted for by the two PCs. The factors were not included when computing the PCs and are shown only as covariates to illustrate their relationship with the responses and the PCs. (Readers unfamiliar with principal component analysis or biplots may refer to our previous publication.46)

