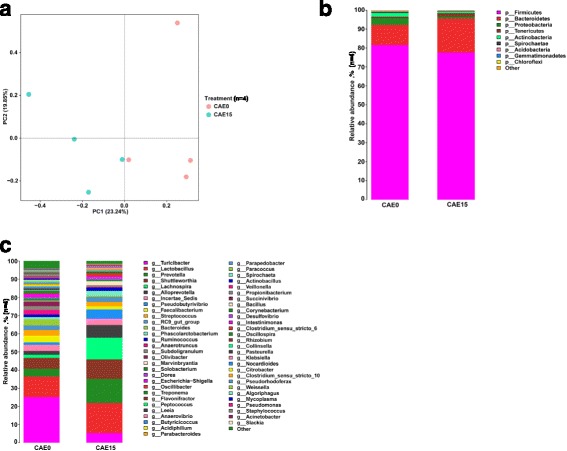
Fig. 2.

Caecal microbiota composition of pigs fed diets with 0% (CAE0) or 15% (CAE15) level of alfalfa meal (n = 4). Principal component analysis evaluated the overall structural changes of the gut microbiota between the CAE0 and CAE15 group (a). Relative abundances of samples evaluated at the phylum (b) and genus (c) levels
