Fig. 4.

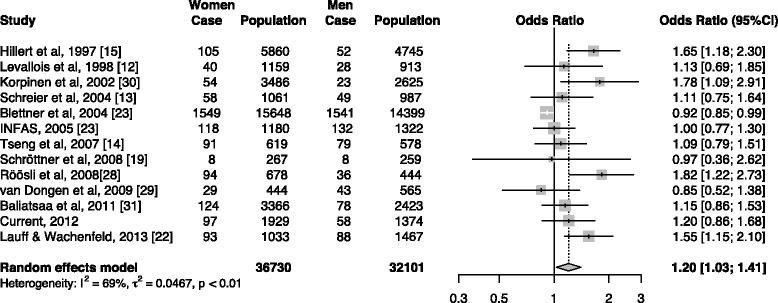
Forest plot of prevalence rates of idiopathic environmental intolerance attributed to electromagnetic fields in men and women. I2 = 69.0%, p < 0.01 for heterogeneous test. The years are the years of investigation

Forest plot of prevalence rates of idiopathic environmental intolerance attributed to electromagnetic fields in men and women. I2 = 69.0%, p < 0.01 for heterogeneous test. The years are the years of investigation