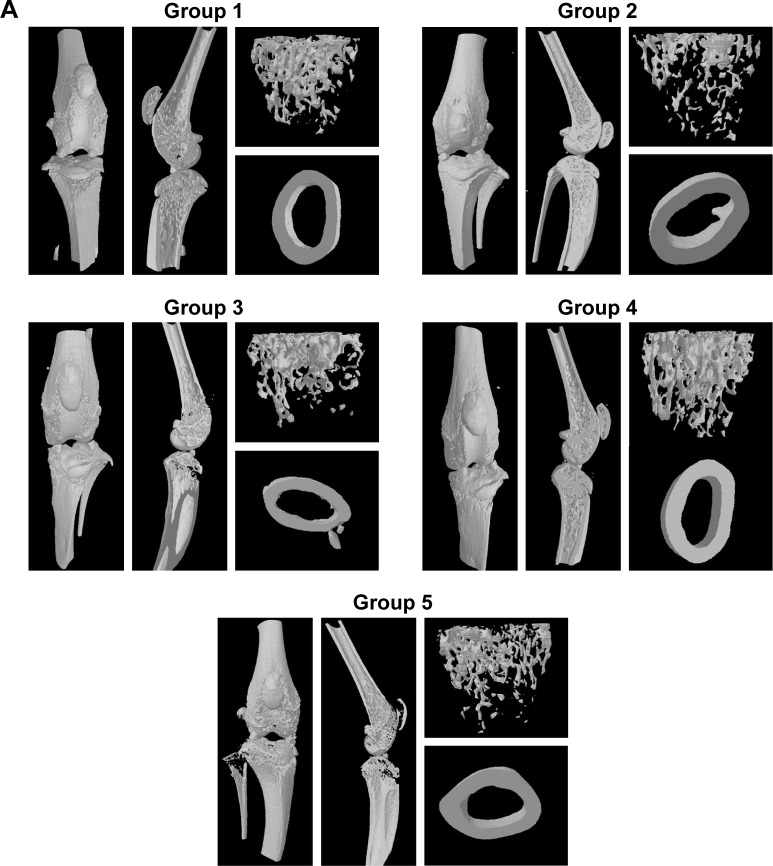
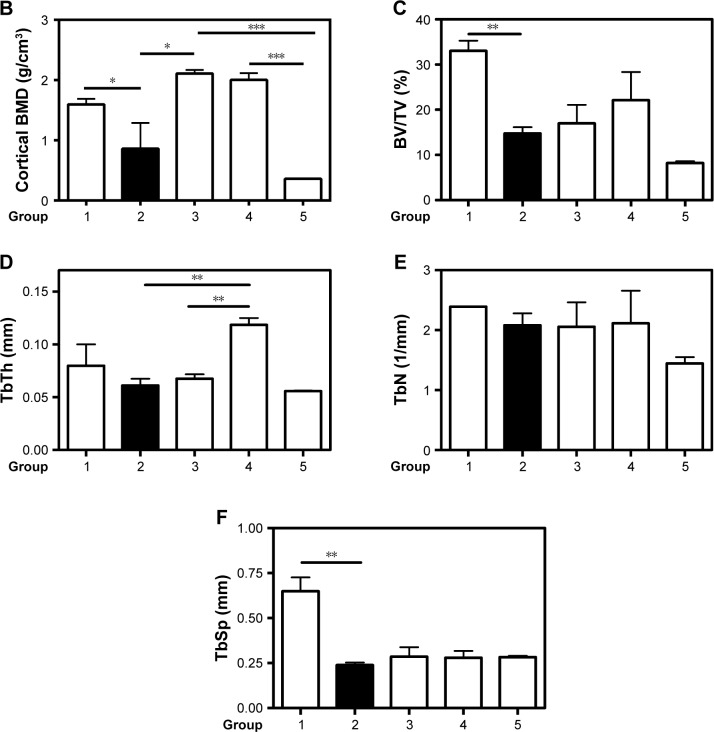
Figure 5.
Micro-CT analysis.
Notes: (A) Representative trabecular bone in micro-CT images of the distal femur in mice from different groups. (B) Cortical BMD in femur diaphysis. (C) Trabecular bone volume as percentage of total volume (BV/TV). (D) TbTh. (E) TbN. (F) TbSp. n=3. Values are the means ± SEM of three mice. Statistical significance was assessed by unpaired Student’s t-test, *P<0.05, **P<0.01, ***P<0.001. Group 1: normal control; group 2: CAIA control; group 3: CAIA mice treated with CH-DEAE15/siRNA-TNFα nanoparticles; group 4: CAIA mice treated with folate-PEG-CH-DEAE15/siRNA-TNFα nanoparticles; group 5: CAIA mice treated with siRNA-TNFα.
Abbreviations: BMD, bone mineral density; BV, bone volume; CAIA, collagen antibody-induced arthritis; CH, chitosan; CTX-II, C-terminal telopeptide type II collagen; DEAE, diethylethylamine; ELISA, enzyme-linked immunosorbent assay; micro-CT, micro-computed tomography; PEG, polyethylene glycol; SEM, standard error of the means; TbN, trabecular bone number; TbSp, trabecular separation; TbTh, trabecular bone thickness; TNFα, tumor necrosis factor-alpha; TV, tissue volume.


