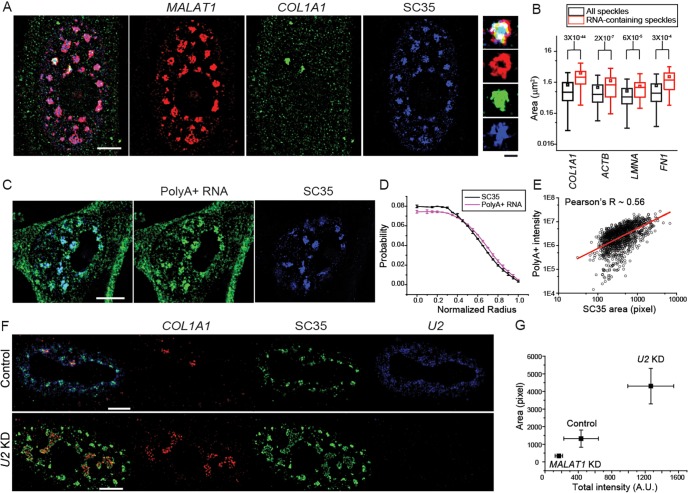
Fig. 6.
RNA accumulation contributes to speckle size variation. (A) Sample image of MALAT1 (red), COL1A1 RNA (green) and SC35 (blue). (B) Box-and-whisker plot of the areas of RNA accumulation site-associated speckles and all speckles from the same cells. P-values (calculated with a Kolmogorov–Smirnov test) are indicated above the plots. All box-and-whisker plots are presented as described in Fig. 2. (C) Sample image of poly(A)-positive (PolyA+) RNA (green) and SC35 (blue). (D) Average radial distribution of poly(A)-positive RNA and SC35. Error bars report standard deviation. (E) Scatter plot of total intensity of poly(A)-positive RNA versus speckle size defined by SC35. The red line designates the linear fitting of the data. (F) Sample image of COL1A1 mRNA (red), SC35 (green) and U2 snRNA (blue) in the control and U2-knockdown (KD) cells. (G) RNA-associated speckle size versus total RNA intensity in the control, MALAT1-knockdown and U2-knockdown cells. Error bars report the standard deviation. Scale bars: 5 µm, cell images; 1 µm, magnified speckle images. All plots contain data from 2–4 independent measurements. Each measurement contains data from 300–1000 speckles and 15–70 RNA-containing speckles from 20–60 cells.

