Fig. 1.
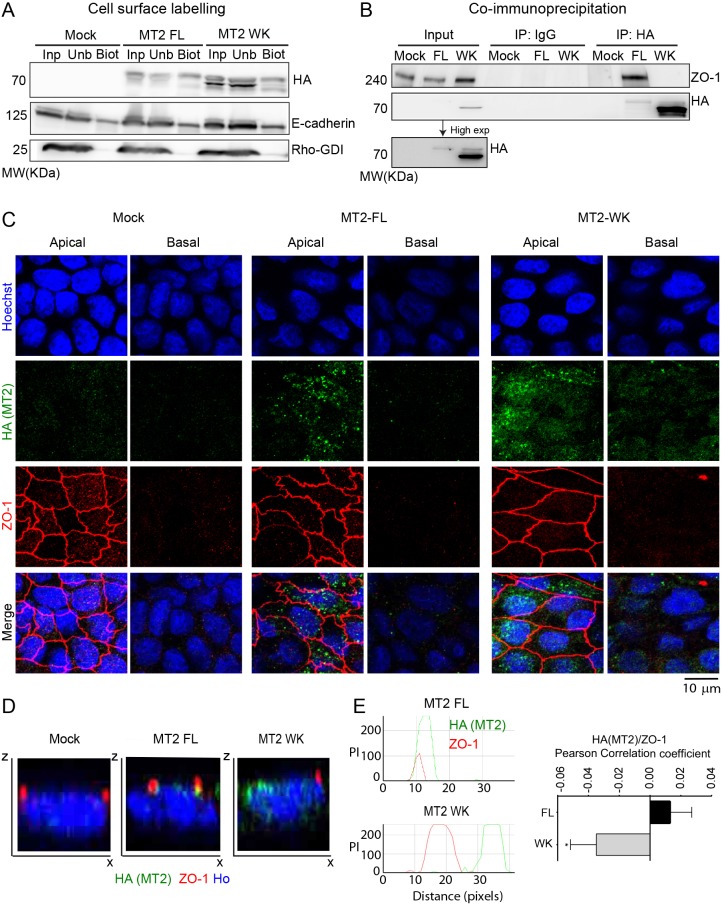
MT2-MMP associates with ZO-1 in polarized MDCK cells. (A) Western blot analysis of HA, E-cadherin and Rho-GDI in biotinylated cell lysates from Mock, MT2-MMP (MT2FL) and MT2-MMPWK (MT2WK) stable MDCK transfectants pulled down with streptavidin beads; input, unbound and bound fractions are shown (Inp, Unb, Biot). (B) Western blot analysis of ZO-1 and HA in cell lysates from Mock, MT2-MMP and MT2-MMPWK stable MDCK transfectants pulled down with anti-HA antibody; IgG immunoprecipitates and whole lysates (Input) are also shown as controls. A blot of the input lanes after a longer exposure is also shown. (C) Representative maximal projections from apical and basolateral stacks of confocal sections from polarized MDCK transfectants stained for HA (MT2-MMP, green), ZO-1 (red) and nuclei (Hoechst, blue). (D) Orthogonal x–z views of 3D confocal image stacks from C. (E) Representative peak intensity profiles from x–z views of 3D confocal image stacks from C. Graph to the right shows the quantification of MT2-MMP/ZO-1 Pearson correlation coefficient in polarized MT2-FL and MT2-WK MDCK transfectants. Values are mean±s.e.m. n=40 cells per condition in two independent experiments; *P<0.05.

