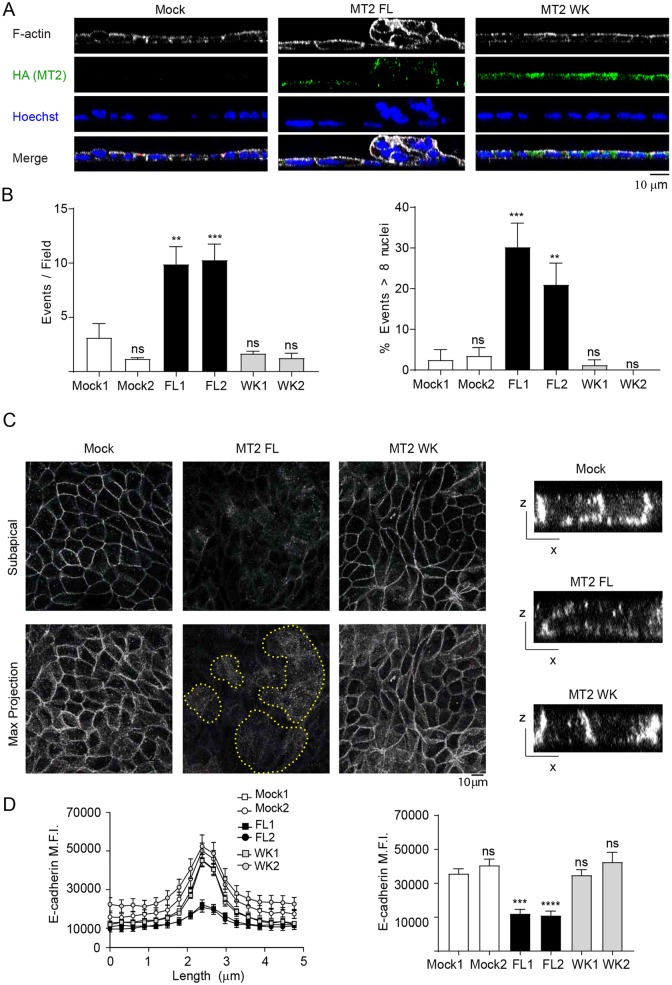
Fig. 2.
MT2-MMP overexpression induces aberrant apical epithelial cell accumulation in polarized MDCK monolayers. (A) Orthogonal x–z projections of 3D confocal image stacks of MDCK transfectants stained for F-actin (Phalloidin, gray), HA (MT2-MMP, green) and Hoechst (nuclei, blue). Scale bar: 10 μm. (B) Quantification of apical epithelial foci per field (left) and the percentage of foci having more than 8 nuclei (right). 10 fields were counted per condition in n=4 independent experiments. (C) Representative maximal projections are shown from subapical and complete stacks of confocal sections from polarized MDCK transfectants stained for E-cadherin (gray). The dotted yellow line marks apical foci. Orthogonal x–z views are shown to the right. (D) Line and bar graphs show E-cadherin peak and average mean fluorescence intensity (MFI), respectively, around the junctions formed by MDCK transfectants. Data are represented as mean±s.e.m. and were tested by one-way ANOVA versus mock 1 followed by Dunnett's post-test in B and C. **P<0.01, ***P<0.001, ****P<0.001; ns, not significant.

