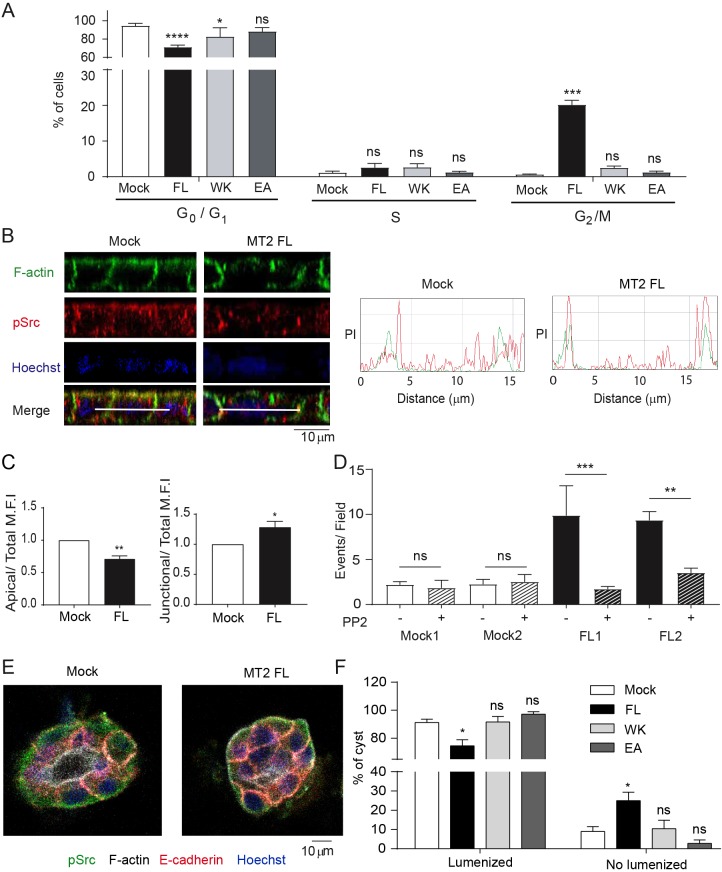
Fig. 6.
Mislocalization of pSrc in polarized MT2-MMP-MDCK cells contributes to apical cell accumulation. (A) Percentage of cells in G0/G1, S, and G2/M phases of the cell cycle analyzed by flow cytometry in propidium-iodide-stained MDCK transfectants after 72 h of serum deprivation. Means±s.e.m. are shown for 3 independent experiments. (B) Orthogonal x–z projections of 3D confocal image stacks of polarized MDCK transfectants (mock and MT2-MMP) stained for F-actin (Phalloidin, green), pSrc (red), and nuclei (Hoechst, blue). Representative peak intensity profiles are shown on the right for pSrc (red) and F-actin (green). (C) Bar graphs show the apical (left) and junctional (right) pSrc intensity, relative to total mean fluorescence intensity (MFI) in 6 independent experiments. (D) Number of apical events occurring in polarized MDCK cells treated with PP2 or vehicle (DMSO). 10 fields were counted per condition in 3 independent experiments. Differences between mock DMSO1 and MT2 FL1, and mock DMSO2 and MT2 FL2 were significant with P<0.001 and P<0.01, respectively. (E) Representative confocal images of 3D cysts formed by MDCK transfectants in Matrigel and stained for pSrc (green), F-actin (white), E-cadherin (red), and nuclei (Hoechst, blue). (F) Quantification of the percentage of lumenized cysts. Data are represented as the mean±s.e.m. and were tested by two-way ANOVA followed by Dunnett's post-test in A, two-tailed Welch-test comparison was used in B, and one-way ANOVA followed by Sidak post-test was used in C. *P<0.05, **P<0.01, ***P<0.001, ****P<0.0001; ns, not significant.

