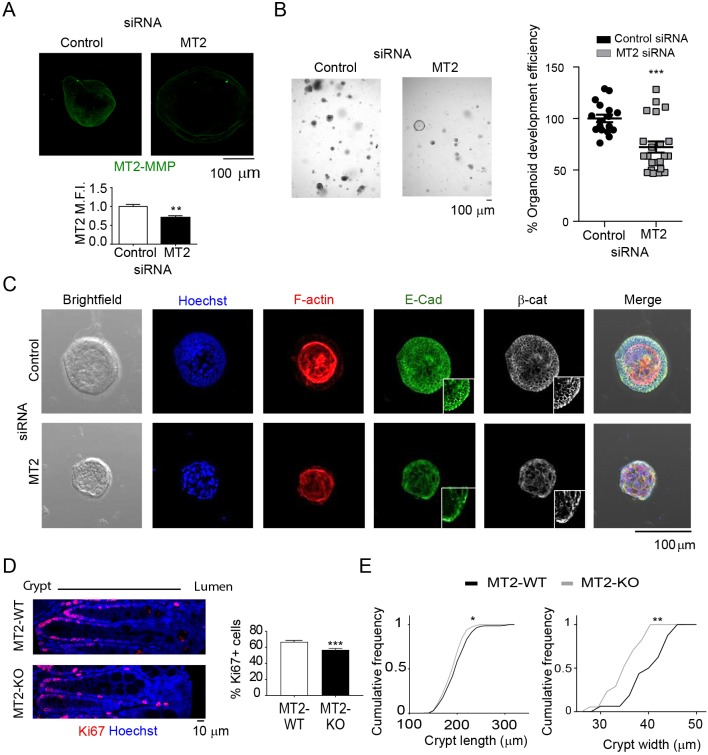
Fig. 7.
MT2-MMP deficiency alters junctional E-cadherin and leads to decreased 3D colon organoid formation ex vivo and smaller crypts in vivo. (A) Representative confocal images of MT2-MMP-silenced colon organoids stained for MT2-MMP (green; top). Graph shows the normalized MT2-MMP mean fluorescence intensity (MFI) in stained organoids 72 h after siRNA transfection (bottom), n=6 images per condition from 3 independent experiments; Mmp15 mRNA levels decreased ∼20% in silenced organoids. (B) Bright-field microscopy images of MT2-MMP-silenced colon organoids. Bar graph shows the percentage of organoid generation efficiency 48 h after siRNA transfection (right) in 3 independent experiments. (C) Representative confocal images of MT2-MMP-silenced colon organoids stained for nuclei (Hoechst/Ho, blue), F-actin (red), E-cadherin (green) and β-catenin (white); magnified views of E-cadherin and β-catenin staining are shown in insets. (D) Representative confocal images of colonic tissues recovered from wild-type or MT2-MMP-null mice, and stained for Ki67 (red) and nuclei (Hoechst, blue). On the right, graph shows the percentage of Ki67-positive cells per crypt. 9–15 crypts were quantified per condition in 3 images taken from 2 mice per genotype (top). (E) Quantification of the cumulative frequency of crypt length (left) and width (right). Data are represented as mean±s.e.m. and were tested by unpaired Student's t-test in A and B and by two-tailed Welch-test comparison in D and E. *P<0.05, **P<0.01, ***P<0.001; ns, not significant.

