Fig. 1.

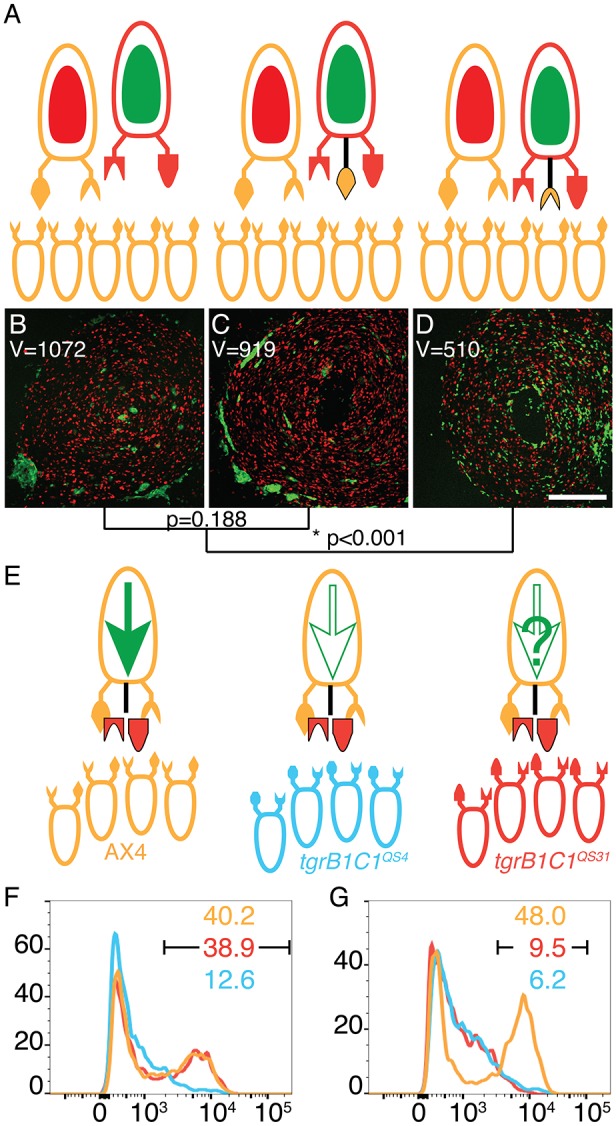
TgrB1 functions as an allotype-specific receptor. (A) Ovoids represent cells, protrusions represent TgrB1 and TgrC1 proteins, and colors represent allotypes: tan, AX4; red, tgrB1C1QS31. Black protrusions represent extra alleles. Internal green and red ovoids represent constitutive GFP and RFP expression, respectively. The larger, single cells on top represent the minority and the smaller cells at the bottom represent the majority strains. (B–D) Cooperative aggregation of mixes of 90% unlabeled AX4 cells with 5% RFP-labeled AX4 (control) and 5% GFP-labeled test cells: tgrB1C1QS31 (B), tgrB1C1QS31tgrC1AX4 (C) and tgrB1C1QS31tgrB1AX4 (D). The spatial distribution variance (V) is shown inside each frame. Comparisons between the variances are shown as a dendrogram below the images with P-values calculated from F-tests; *P<0.001. Scale bar: 0.3 mm. (E) Cooperative differentiation with mixes of 0.2% AX4 cotB-GFP cells expressing an extra allele of either tgrB1QS31 or tgrC1QS31 with 99.8% unlabeled cells of different allotypes: tan, AX4; blue, tgrB1C1QS4; red, tgrB1C1QS31. A full green arrow inside the cell represents cotB-GFP expression; empty arrow indicates no expression. We evaluated GFP fluorescence levels by flow cytometry and plotted the results as histograms for tgrB1QS31 (F) and tgrC1QS31 (G). The x-axes represent fluorescence intensify (arbitrary units) and the y-axes, the number of events. Black bars inside the histograms indicate the GFP-positive populations and the respectively colored numbers indicate the fraction (%) of GFP-positive cells.
