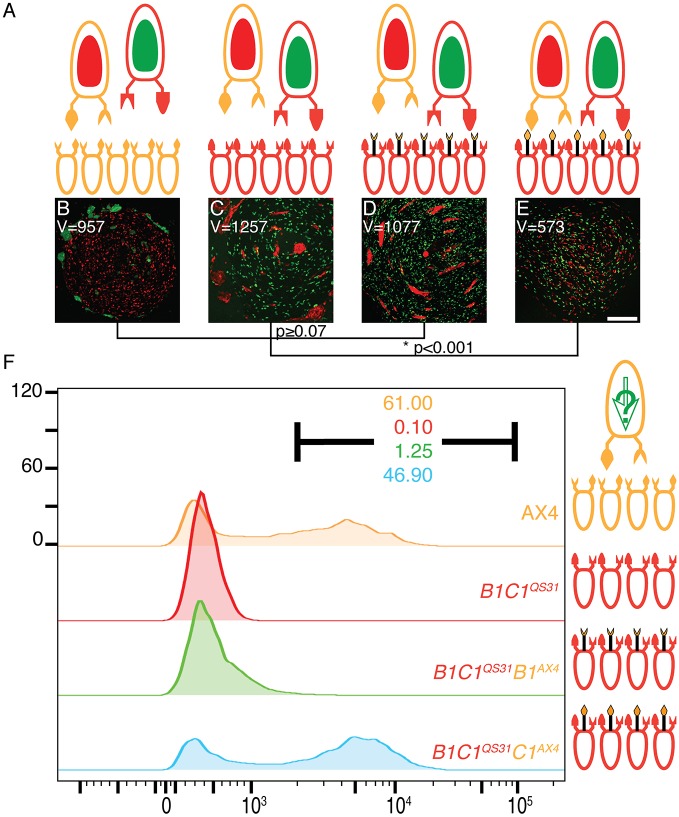
Fig. 2.
TgrC1 functions as an allotype-specific ligand. (A–E) Cooperative aggregation of mixes of 90% unlabeled cells with 5% RFP-labeled AX4 and 5% GFP-labeled tgrB1C1QS31 cells. The unlabeled majority cells were: AX4 (B), tgrB1C1QS31 (C), tgrB1C1QS31tgrB1AX4 (D) and tgrB1C1QS31tgrC1AX4 (E). The spatial distribution variance (V) is shown inside each frame. Comparisons between the variances are shown as a dendrogram below the images with P-values calculated from F-tests; *P<0.001. Scale bar: 0.2 mm. (F) Cooperative differentiation of mixes of 0.2% AX4 cotB-GFP cells (minority, large cell on top) with 99.8% unlabeled host cells from 4 different strains as illustrated on the right. GFP fluorescence levels were assessed by flow cytometry results plotted as histograms: AX4 (positive control, tan), tgrB1C1QS31 (negative control, red) and tgrB1C1QS31 expressing an extra allele of either tgrB1AX4 (green) or tgrC1AX4 (blue). The x-axis represents fluorescence intensify (arbitrary units) and the y-axis the number of events. The black bar indicates the GFP-positive populations and the respectively colored numbers indicate the fraction (%) of GFP-positive cells.

