Fig. 4.
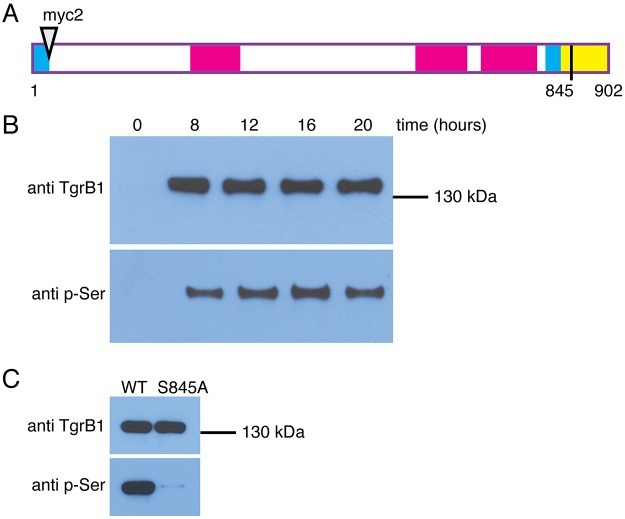
Phosphorylation of TgrB1 on serine 845. (A) Schematic representation of Myc-tagged TgrB1. Cyan bars represent the signal peptide at the N-terminus and the transmembrane domain near the C-terminus; magenta bars represent the IPT/TIG domains and the yellow bar represents the cytoplasmic domain. Amino acid numbers are shown below the illustration, which is drawn to scale. The triangle near the N-terminus represents an insertion of two Myc epitopes immediately after the signal peptide (not to scale). The black line represents serine 845. (B) Western blot analysis of protein pulled down with anti-Myc antibodies from cells expressing TgrB1myc2AX4 developed for the indicated times (hours). (C) Western blot analysis of cells expressing either TgrB1myc2AX4 (WT) or the mutant TgrB1myc2AX4S845A (S845A) developed for 12 h.

