Fig. 7.

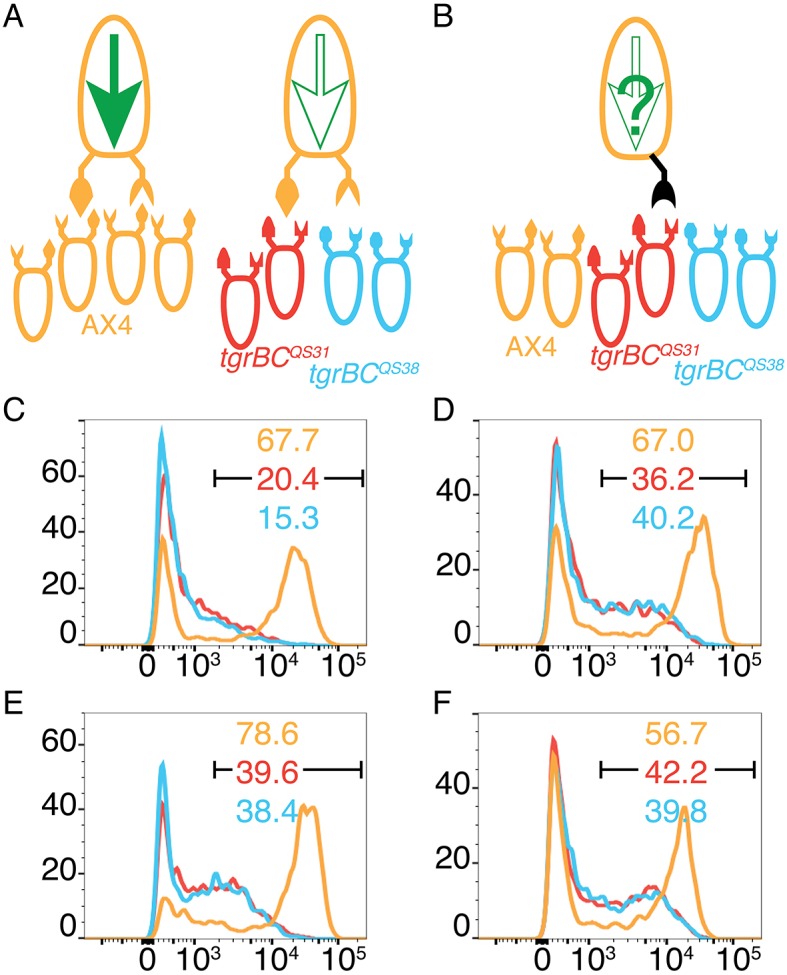
Dominant alleles of tgrB1 activate the receptor function. (A,B) Mixes of 0.2% cells carrying cotB-GFP and 99.8% unlabeled cells of different allotypes: AX4 (tan), tgrB1C1QS31 (red), tgrB1C1QS38 (blue). Ovoids represent cells, protrusions represent TgrB1 and TgrC1 proteins. The larger, single cells on top represent the minority and the smaller, bottom cells represent the majority strains (each tested separately). A full green arrow inside the cell represents cotB-GFP expression; empty arrows indicate no expression. (A) Controls made by mixing with compatible AX4 cells results in cotB-GFP expression and mixing with either one of the incompatible strains results in no expression. (B) The black protrusion represents expression of one of the tgrB1 dominant alleles in the absence of resident tgrB1 or tgrC1. (C–F) GFP fluorescence levels assessed by flow cytometry and plotted as histograms. The x-axes represent fluorescence intensity (arbitrary units) and the y-axes, the number of events. The black bar indicates the GFP-positive populations and the numbers indicate the respective fractions (%) of GFP-positive cells. The majority cells are as indicated by the line colors. The minority cotB-GFP cells carry the dominant tgrB1 alleles: tgrB1G275D (D), tgrB1G307D (E) or tgrB1L846F (F).
