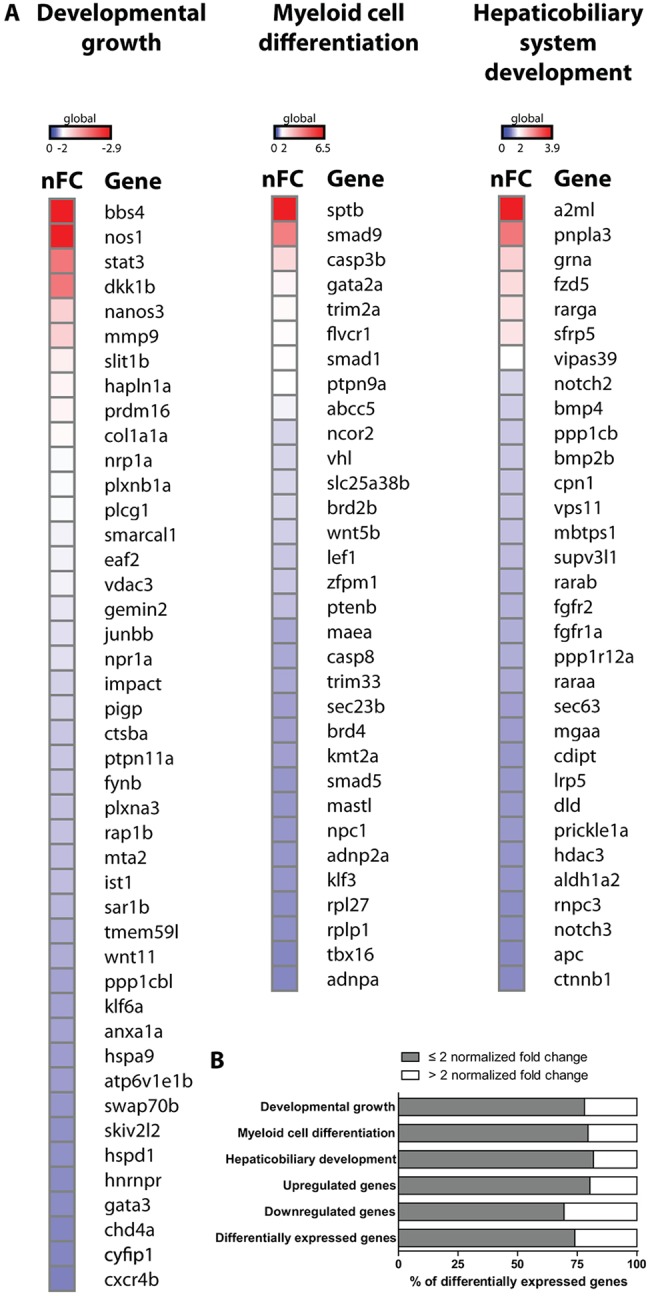
Fig. 7.

Heatmap of differentially expressed genes in mecp2-null embryos. (A) Heatmap displaying the extent of differential gene expression between 6 hpf mecp2-null versus wild-type embryos. The genes incorporated in the heatmap represent all differentially expressed genes that belong to the GO terms ‘developmental growth’ (downregulated genes), ‘myeloid cell differentiation’ (upregulated genes) and ‘hepaticobiliary system development’ (upregulated genes). For all genes, the positive or negative normalized fold change (nFC) for mecp2-null embryos versus wild-type embryos is shown. (B) The graph displays the percentage of significantly differentially expressed genes in mecp2-null versus wild-type embryos with a fold change ≤2 or >2. The following groups are shown: significantly differentially expressed genes belonging to the GO terms ‘developmental growth’, ‘myeloid cell differentiation’ and ‘hepaticobiliary system development’; genome-wide significantly upregulated genes; genome-wide significantly downregulated genes; and all significantly differentially expressed genes.
