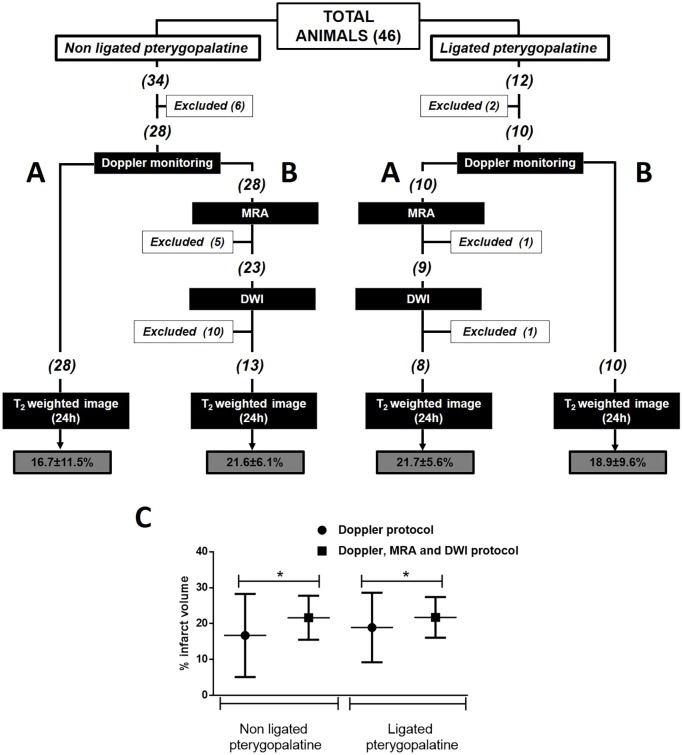
Fig. 1.
Protocol diagram summarizing the number of animals included, with exclusions per group, for final analysis. Two experimental groups were compared: (A) animals evaluated with only laser Doppler monitoring; (B) animals evaluated with laser Doppler monitoring, MR angiography and DWI. The two groups were compared in animals with and without occlusion of the pterygopalatine artery. (C) Infarct volume determined 24 h after ischaemia for the two inclusion protocols used in rats with and without pterygopalatine artery occlusion. Data are expressed as mean±s.d. Student's t-test was used to compare the differences between the means, and F-test was used to compare differences in variability. Means were similar for both inclusion protocols, while the variability was significantly reduced with the new inclusion protocol suggested (*P<0.05).

