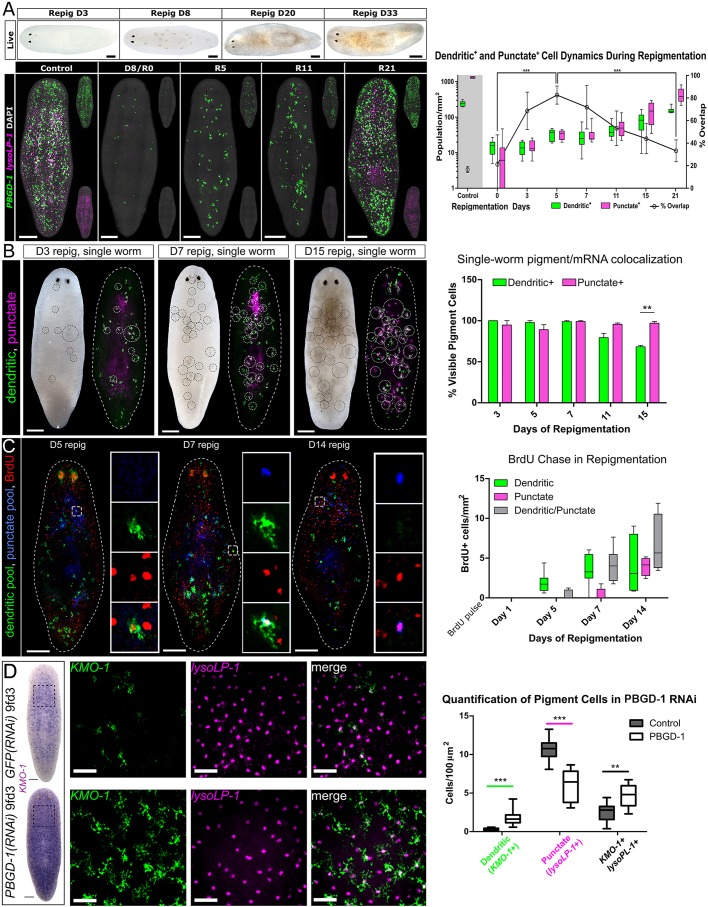
Fig. 4.
Dynamics and birth order of dendritic+ and punctate+ pigment cells during repigmentation. (A) (Top) Bright-field images showing repigmentation timeline of S. mediterranea following complete depigmentation by light exposure treatment. (Bottom) FISH of dendritic+ (PBGD-1) and punctate+ (lysoLP-1) pigment cells from repigmentation day 0 (R0) to day 21 (R21). (Right) Dendritic+ and punctate+ pigment cells demonstrate distinct birth dynamics after light-induced depigmentation. Percentage overlap refers to punctate+ cells that also express dendritic markers. Statistics shown: P-value (two-tailed, unpaired t-test) summary of percentage overlap comparisons between D0 and D5, and between D5 and D21. (B) Single-worm repigmentation live images combined with dFISH. An image was taken immediately following fixation and the pigmentation circled (left of each pair). Images were processed by changing the gamma value to enhance visualization of pigment. After dFISH for dendritic pooled markers and punctate pooled markers, the same circles were overlaid (right of each pair) and cells quantified inside the circles (bar chart on right). (C) (Left) BrdU pulse at day 0 of repigmentation and chased for the time shown. The boxed region is magnified in insets, which show single channels. (Right) Quantification of the identity of BrdU+ cells. (D) (Left) Representative animals stained for the dendritic marker KMO-1 in control (top row) or PBGD-1 (bottom row) RNAi. The boxed region is magnified in insets, which show dFISH for KMO-1 and lysoLP-1. (Right) Quantification of how markers change in PBGD-1 RNAi. Two-tailed, unpaired t-test. **P<0.01, ***P<0.001. Scale bars: 250 μm in A-D; 50 μm in boxed regions of D.

