Fig. 3.
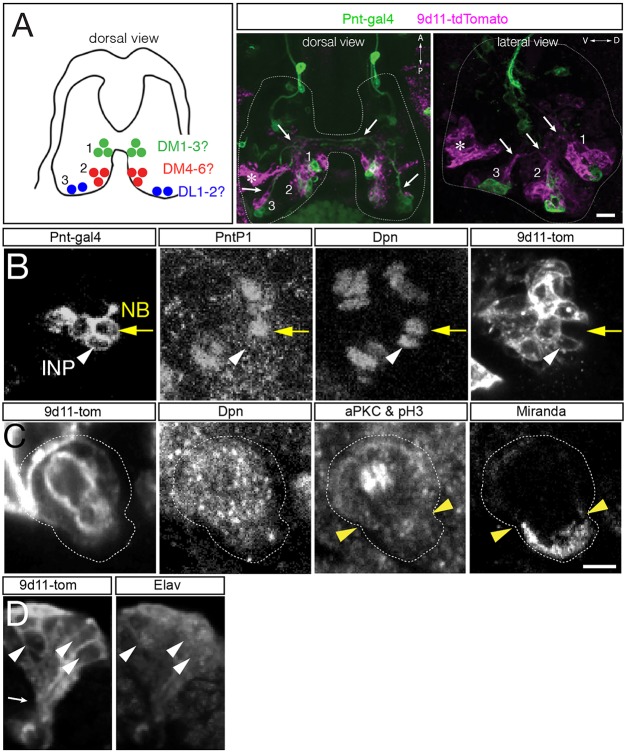
Embryonic INPs undergo asymmetric cell division. (A,B) R9D11-tdTomato (9D11-tom) labels embryonic INPs and their progeny, but not type II neuroblasts. (A) Left: summary of type II neuroblast positions (dorsal view). Center and right panels: dorsal or lateral view of the three type II neuroblast clusters labeled with Pnt-gal4 (green; type II neuroblasts and progeny) and 9D11-tom (magenta; INPs and progeny). Axon fascicles are visible in dorsal and lateral views (white arrows). Note there is 9D11-tom expression at a deep ventral location that is not near any type II lineage (asterisk). (B) Type II neuroblast (Pnt-gal4+ PntP1+ Dpn+ 9D11-tom−; yellow arrow); INP (Pnt-gal4+ PntP1− Dpn+ 9D11-tom+; white arrowhead) at stage 16. n>10 for experiment shown. (C) Embryonic INPs undergo asymmetric cell division. INPs were identified as 9D11-tom+ Dpn+ and positioned within the middle cluster of neuroblasts in the dorsal posterior medial brain lobe. aPKC and pH3 are co-stained: aPKC is localized to the larger apical cell cortex (white cortex above arrowheads; future INP daughter cell) whereas pH3 decorates the mitotic chromosomes in the middle of the INP. Miranda is localized to the smaller basal cell cortex (cortex below arrowheads; future GMC daughter cell). n>5 for mitotic INPs. (D) Embryonic INPs generate embryonic-born neurons. Lateral view of a 9D11-tom+ cluster in a stage 16 embryo. The post-mitotic neuronal marker Elav is detected in a subset of the 9D11-tom+ cluster (white arrowheads), and axon projections can be observed (white arrow, bottom left). Scale bars: 15 μm (A); in C: 10 μm (B), 5 μm (C,D). n>10 for the experiment shown.

