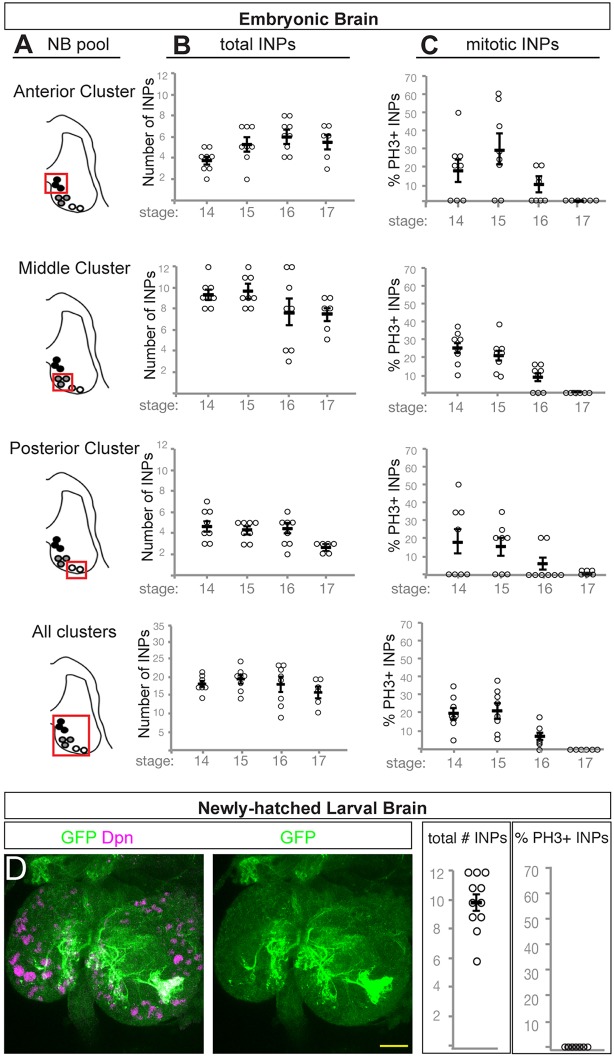
Fig. 4.
INPs undergo quiescence across the embryo-larval transition. (A) Schematic outlining the three pools of type II neuroblast INP progeny assayed in B and C (red box). (B) Total number of INPs per pool at the indicated stages; INPs identified as 9D11-tom+ Dpn+ cells. Each circle represents the number of INPs per brain lobe. (C) Number of phospho-histone H3 (pH3)-positive mitotic INPs per pool at the indicated stages; INPs are identified as 9D11-tom+ Dpn+ cells. Each circle represents the number of INPs in the cluster of neuroblasts shown in A; black bar represents the average, shown with s.e.m. (D) Quiescent INPs are present in the newly hatched larva. INPs marked with 9D11-gal4 UAS-tdTomato (green); brain neuroblasts and INPs marked with Dpn (magenta). Anterior up, left and right brain lobes shown. Scale bar: 15 μm.

