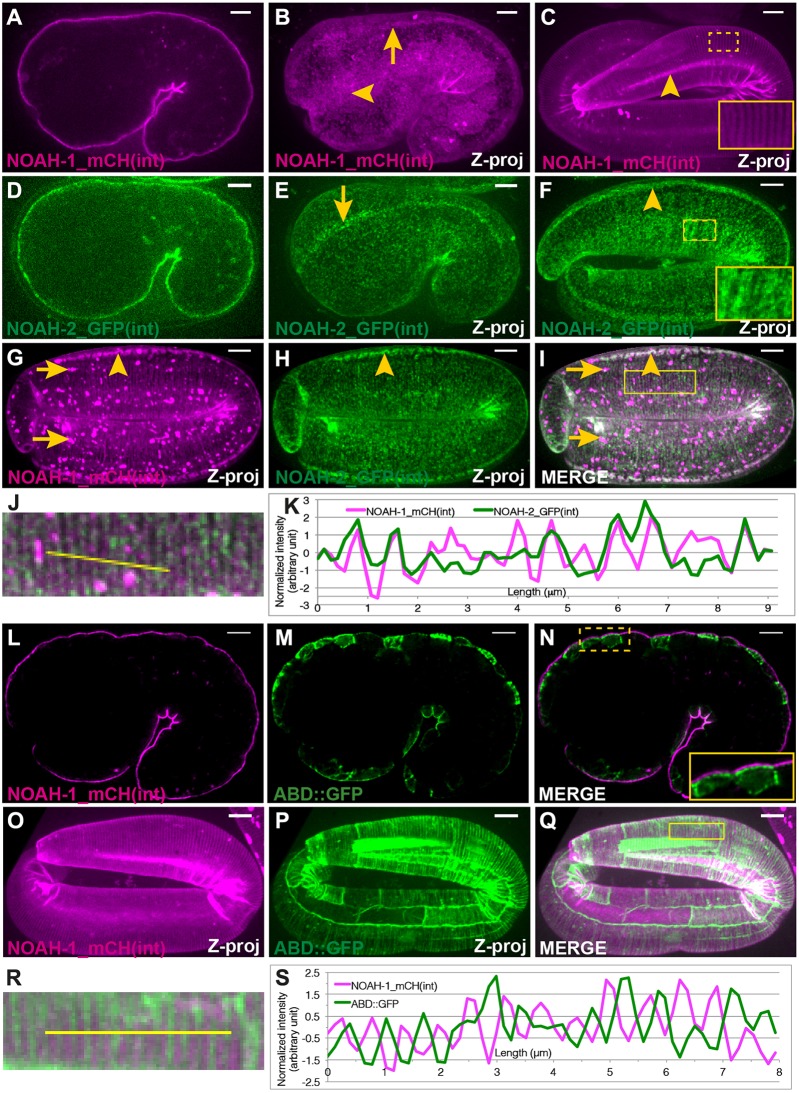
Fig. 2.
NOAH-1 and NOAH-2 colocalize at the epidermal apex in areas located between actin bundles. (A-F) Fluorescent images of NOAH-1_mCH(int) (A-C) and NOAH-2_GFP(int) (D-F) at the 1.5-fold (A,B,D,E) and pretzel (C,F) stages showing how they wrap around embryos. (A,D) Focal plane through the middle of the embryos; (B,C,E,F) z-projections (Z-proj). NOAH-1 and NOAH-2 were enriched at structures reminiscent of CeHD localization and pattern (arrows in B,E) and in seam cells (arrowheads in B,C,F; see O-Q and Fig. 3A′,A″ for seam cell position). (G-K) z-projection images of a 3-fold embryo carrying both NOAH-1_mCH (int) (G) and NOAH-2_GFP(int) (H); (I) merged image. NOAH-1 and NOAH-2 colocalized in seam cells (arrowheads). Note that the presence of NOAH-2_GFP(int) marker induced some aggregation of NOAH-1_mCH(int) (arrows) rarely seen in control (C). (J) Magnified view of the boxed area in I. (K) Normalized line profile of the yellow line in J. NOAH-1 peaks coincide with those of NOAH-2. (L-Q) Fluorescent images of embryos expressing NOAH-1_mCH(int) (L,O) and an actin-binding reporter (ABD::GFP; M,P) at the 1.5-fold (L-N; single focal plane through the middle) and 3-fold (O-Q; z-projection) stages. (N,Q) Merged images; inset in N shows that NOAH-1_mCH(int) localized apically to cortical actin. (R) Magnified view of the boxed area in Q. (S) Normalized line profile of the yellow line in R. NOAH-1 stripes alternate with actin stripes. Insets in C,F,N show higher magnifications of the boxed areas. Scale bars: 5 μm.

