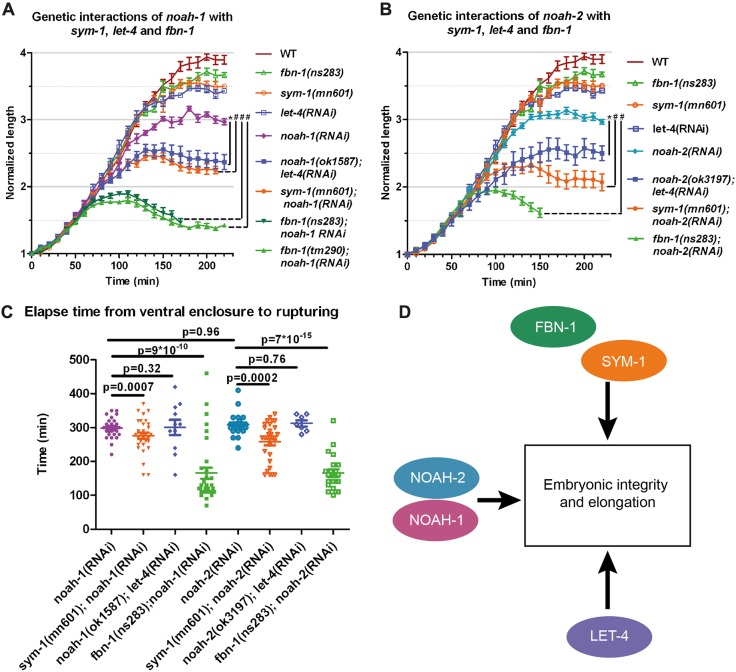
Fig. 4.
NOAH-1/2 act in a parallel pathway to SYM-1, FBN-1 and LET-4. (A,B) Embryonic elongation curves in different genetic backgrounds. n≥9 except for noah-2(ok3197); let-4(RNAi) embryos (n=7). (C) Time interval from ventral enclosure to the first rupturing signs in different genetic backgrounds. (D) Proposed scheme of NOAH-1/2, SYM-1, FBN-1 and LET-4 interactions. The mean and s.e.m. from experimental data are presented; P-values from two-tailed t-tests are shown. For A and B, t-test was performed using the embryo length at 150 min after ventral enclosure; *P<0.001, #P<0.0001.

