Fig. 7.
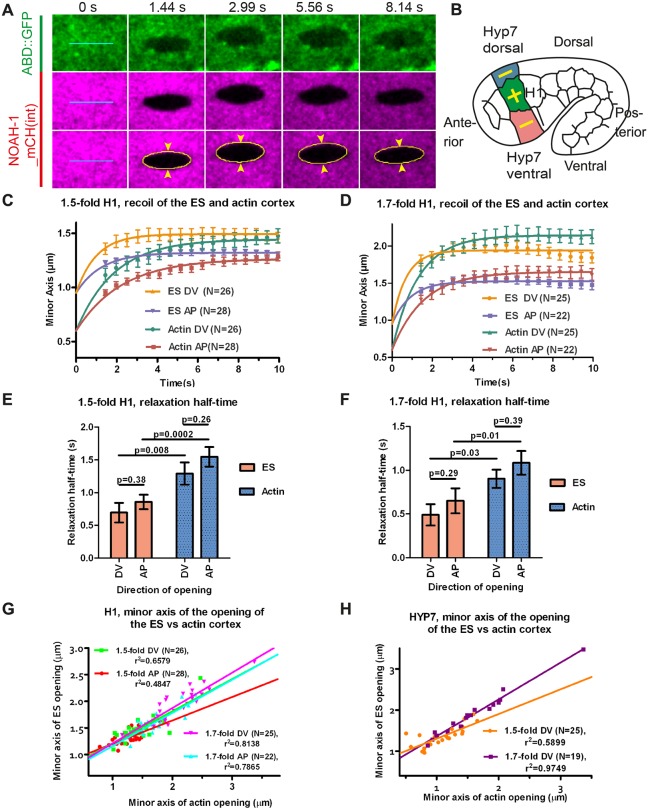
The embryonic sheath transmits actomyosin stress. (A) Time-lapse video micrographs before (0 s) and after laser ablation (1.44 s is the first image after ablation) of the actin cortex and the ES in the seam cell H1 of a 1.7-fold embryo. Cyan lines, 5 µm-long laser cuts; yellow line, elliptical fit of the cut opening (only shown for the ES); arrowheads, distance between the cut borders (minor axis of the opening ellipse). (B) Ablations were performed in the H1 cell (along the AP and DV directions, yellow cross) and in its dorso-ventral HYP7 neighbors (along the AP direction, yellow lines). (C-F) Plot and single exponential fit of the minor axis of the cut opening versus time (C,D) and relaxation half-time (E,F) for the embryonic sheath and the actin cortex at the 1.5-fold (C,E) and 1.7-fold (D,F) stages for the seam cell H1 (see Eqns 2 and 3 in Materials and Methods). P-values obtained from Z-test. (G,H) Minor axis of the opening at equilibrium of the embryonic sheath plotted against that of the actin cortex for the cell H1 (G) and the cell HYP7 (H) derived from curve fitting in C and D. Solid lines, linear fit with r2 values are shown; N, number of ablated embryos. DV and AP indicate directions perpendicular to the cut direction (AP and DV, respectively). The mean and s.e.m. from experimental data (C,D) and curve fitting (E,F) are presented.

