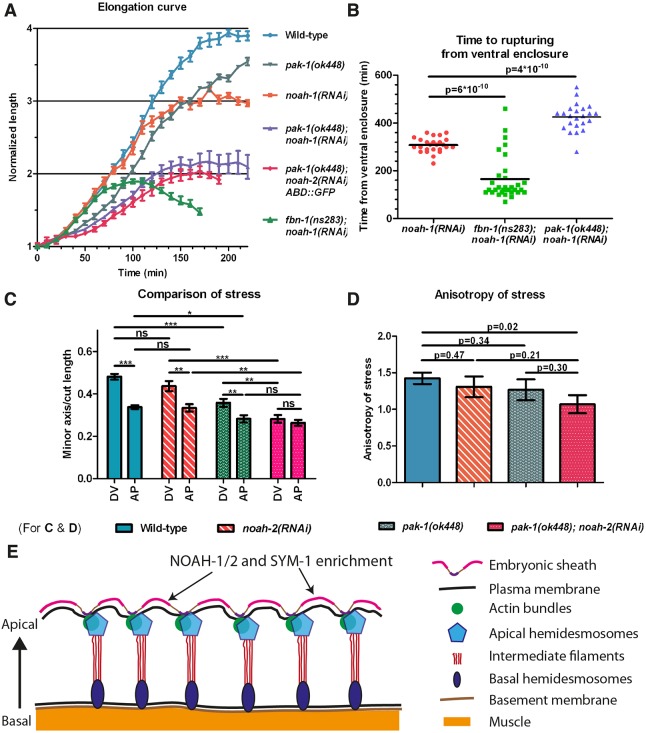
Fig. 8.
pak-1 and noah-1/2 cooperate to maintain stress anisotropy during embryonic elongation. (A) Elongation curves in different genetic backgrounds; mean and s.e.m. is presented, n≥9. (B) Time interval from ventral enclosure to the moment that embryo rupturing signs were first observed for different genetic backgrounds. Note that all pak-1(ok448) embryos hatch without rupturing (n=51/51). (C) Ratio of the minor axis opening over cut length for the seam cell H1 at a stage equivalent to 1.7-fold for different genetic backgrounds. The s.e.m. was obtained from curve fitting. P-values obtained from two-tailed t-test. ns, not significant; *P<0.05, **P<0.01, ***P<0.001. DV and AP, directions perpendicular to the cut directions. (D) Anisotropy of stress and s.e.m. calculated from the data shown in C; P-values obtained from Z-test. (E) Diagram showing the hypothetical position of NOAH-1/2 and SYM-1 (FBN-1) sheath proteins; the areas of enrichment were drawn approximately.

