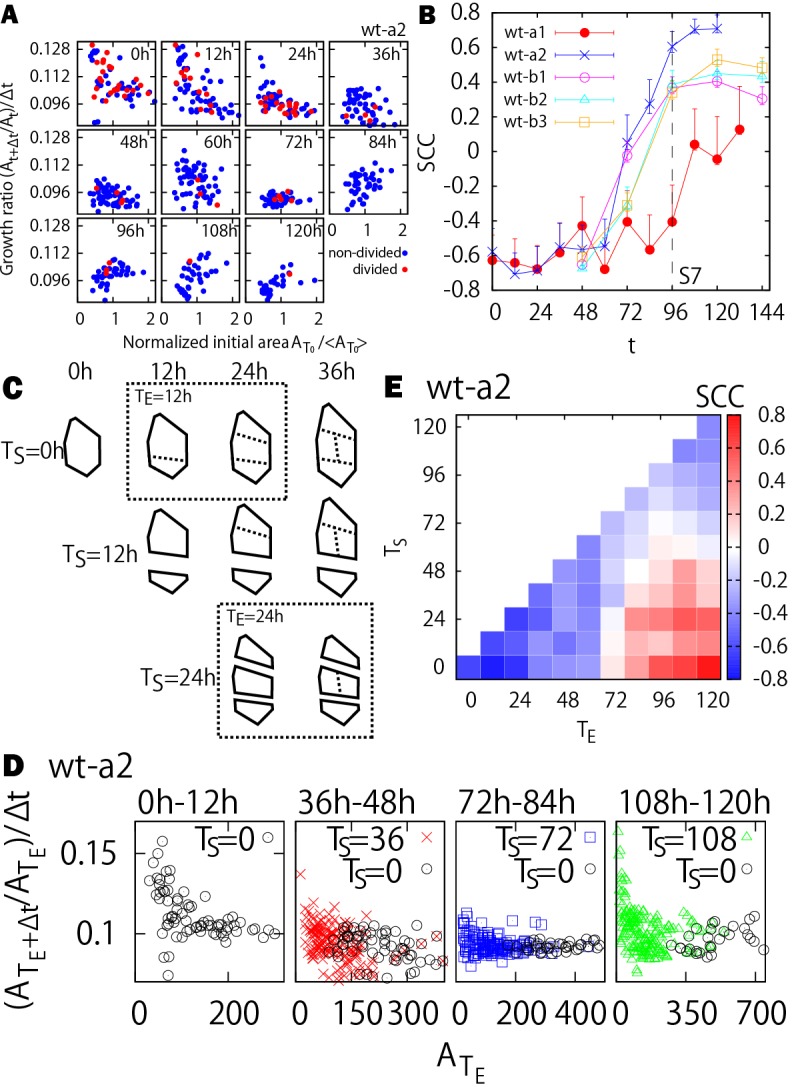
Fig. 4.

Size uniformization depends on the starting time of the clone. (A) Plot of growth ratio at each time step (At+Δt/At)/Δt versus normalized initial area  for the sepal wt-a2. Here, the normalized initial area is considered for a better visual comparison of areas at different time points. The dividing and nondividing clones are colored in red and blue, respectively. (B) SCCs for the plots in A. The SCCs change from negative to positive at around stage 6-7 (72-96 h). (C) Schematic illustration of the definition of the clone from starting time TS. The dashed outline boxes show some examples of the definition (TE=12 h for TS=0 or TE=24 h for TS=24). (D) Size and growth rates of the different clones. (E) SCCs for different combination of TE and TS.
