Fig. 1.
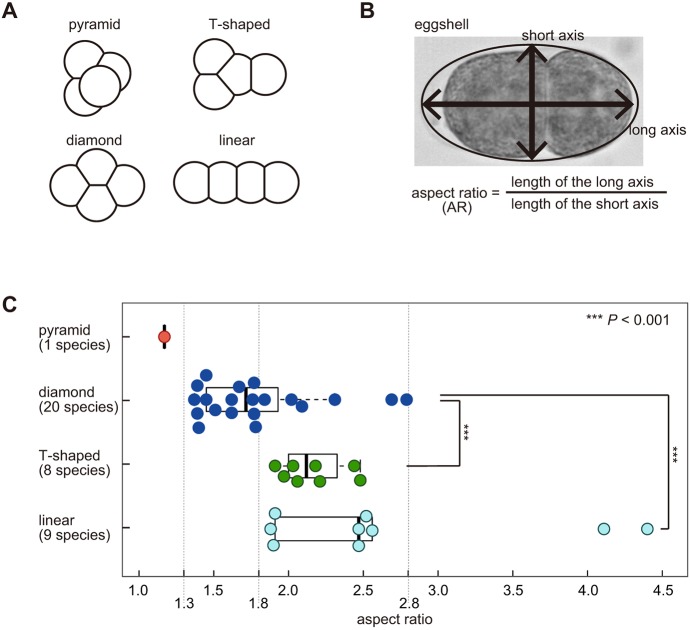
Cell arrangement patterns in various nematode species. (A) Classification of the cell arrangement patterns: Depending on the cell–cell contact, the patterns at the four-cell stage are classified into ‘pyramid’, ‘diamond’, ‘T-shaped’, or ‘linear’ types. (B) The AR was calculated as the length of the long axis divided by that of the short axis of the eggshell. (C) Bee swarm plot and box plot of the AR depending on the cell arrangement pattern (red, pyramid type; blue, diamond type; green, T-shaped type; cyan, linear type) in embryos of various nematode species; all data are summarized in Table S1. The box represents the 25-75th percentiles, and the median is indicated. The upper whisker shows the lower of the maximum or the upper quartile plus 1.5 times the inter-quartile range (IQR). The lower whisker shows the higher of the minimum or the lower quartile minus 1.5 times the IQR. Asterisks represent statistical significance as determined by Wilcoxon's rank-sum test. ***P<0.001 versus diamond arrangement.

