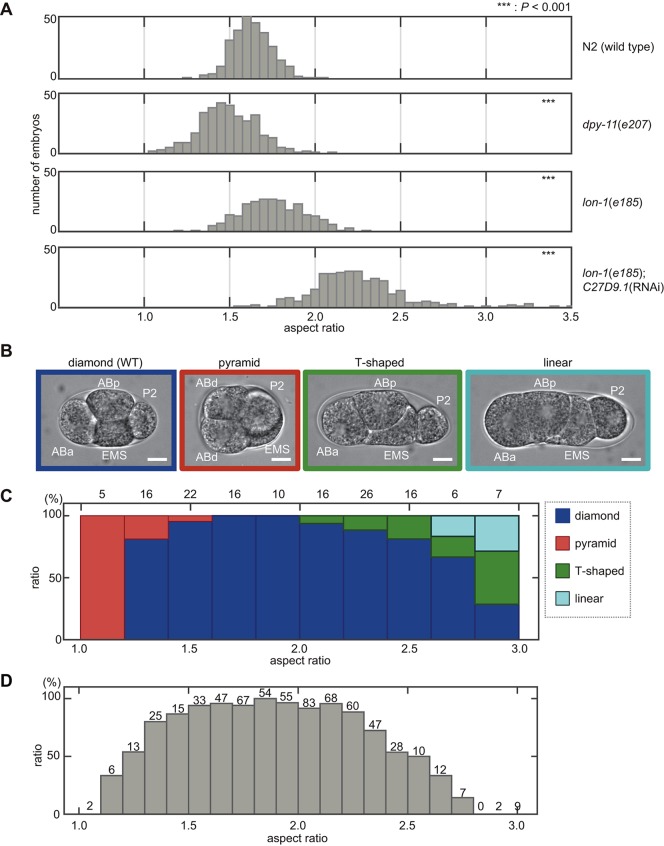
Fig. 2.
Eggshell shape determines cell arrangement pattern in the C. elegans embryo. (A) Histograms showing the ARs in C. elegans mutants and RNAi-treated strains. The means±s.d. of the eggshell shapes from all embryonic stages are: N2 (wild type) (1.6±0.1, n=281), dpy-11(e207) (1.5±0.2, n=331), lon-1(e185) (1.8±0.2, n=258), lon-1(e185); C27D9.1 (RNAi) (2.3±0.3, n=322). ***P<0.001 versus N2 (wild type). Student's t-test was used for dpy-11(e207), lon-1(e185); Wilcoxon's rank-sum test was used for lon-1(e185); C27D9.1 (RNAi). (B) Micrographs showing the different cell arrangement patterns at the four-cell stage of C. elegans embryos: for the pyramid-type arrangement, the daughter cells of the AB cell are indicated ‘ABd’ as we were unable to distinguish between ABa and ABp in this arrangement. Scale bars: 10 μm. (C) Relationship between the percentage of the four types of cell arrangement found (blue, diamond type; red, pyramid type; green, T-shaped type; cyan, linear type) and the ARs (n=188). The data are for four strains: N2, dpy-11(e207), lon-1(e185), and C27D9.1 RNAi-treated strains on a lon-1(e185) background. The numbers above the bars represent the number of the four-cell stage embryos. (D) Dependence of hatch rate on AR (n=643); the data are for five strains: N2, dpy-11(e207), lon-1(e185) and C27D9.1 RNAi-treated strains on a N2 or lon-1(e185) background. The numbers above the bars represent the number of embryos.

