Fig. 3.
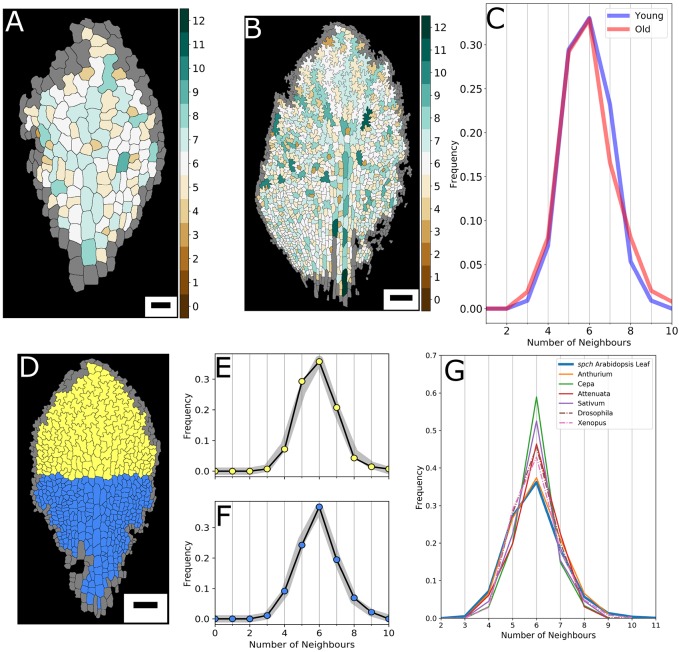
Topological distributions over time and space. (A,B) Number of neighbours for each cell for a leaf at 193.25 HAS (A) and at 286.50 HAS (B). (C) Distributions of neighbour frequencies for the ‘young’ (A) and ‘old’ (B) leaf. (D) Meristematic (blue) and differentiation (yellow) zone of a leaf at 232.62 HAS. (E) Topological distribution for the complex-shaped yellow cells, compared with the distribution for that whole leaf (grey). (F) Topological distribution for the blue, less complex and dividing cells, again compared with the whole-leaf distribution (grey). (G) Average topological distributions for animal (broken lines; Gibson et al., 2006) and plant (unbroken lines; Mombach et al., 1990) epidermal tissues from a range of species. The aggregate spch dataset consisting of 50,000 PCs presents the least frequent six-sided neighbourhood and most frequent five- and four-sidedness. Scale bars: 20 µm in A; 100 µm in B,D.

