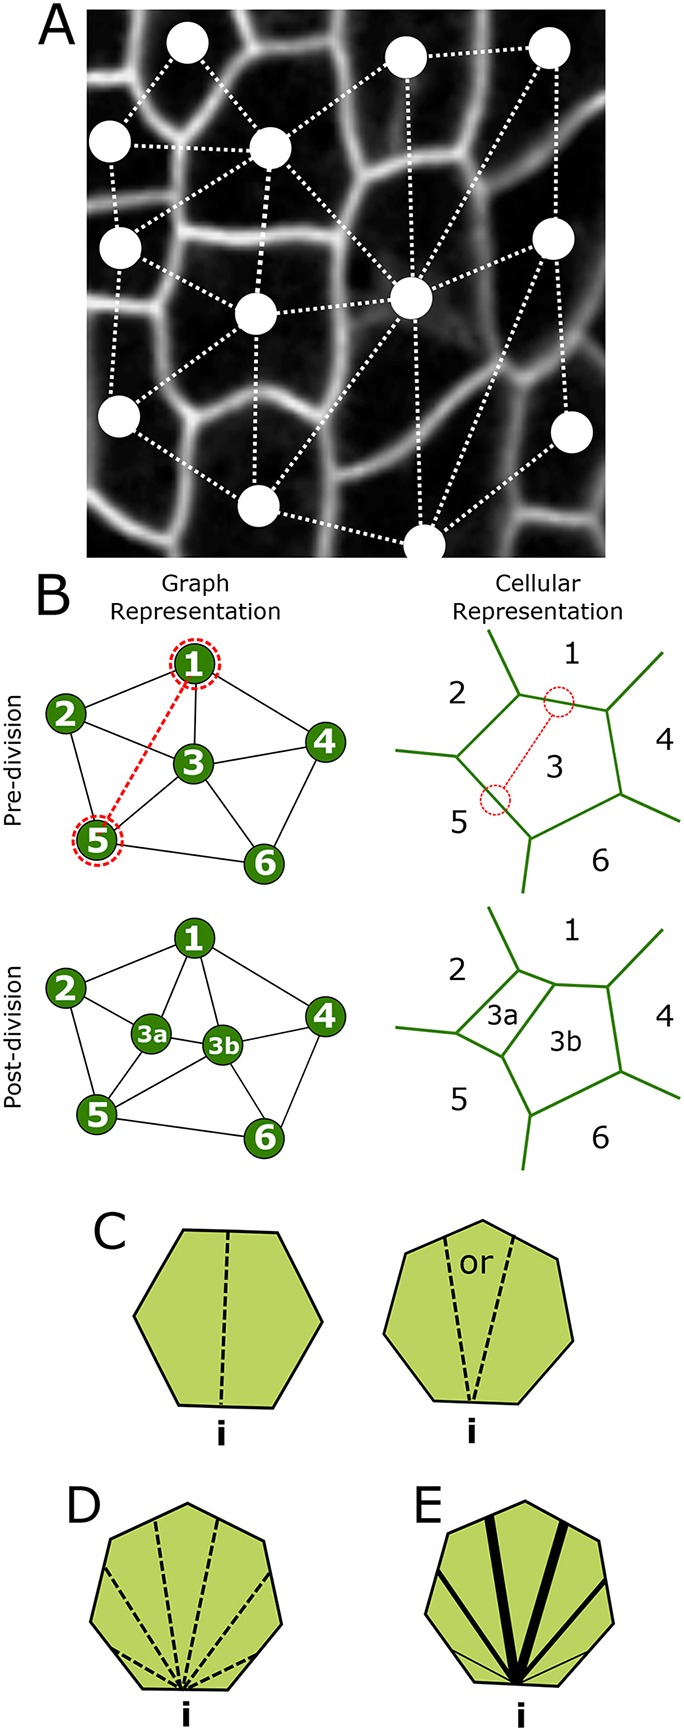
Fig. 4.

Graph model for cell divisions. (A) Network/graph representation superimposed to a cellular representation. Cells are represented by nodes; neighbours by links. (B) Schematic of division implementation within the graph model (left), and its equivalence in space-embedded cellular representation (right). (C-E) The three different division rules, where i represents the initial, randomly selected, wall. (C) ‘Equal split’: neighbours are equally split between the two daughter cells if the cell has an even number of neighbours (left); otherwise, a random choice is made regarding the remaining neighbour (right). (D) ‘Random split’: equal chance for neighbours to be split in any ratio. (E) ‘Pascal split’: neighbour splitting follows a binomial probability, as derived by Gibson et al. (2006), with splits in equal neighbour numbers being more favourable.
