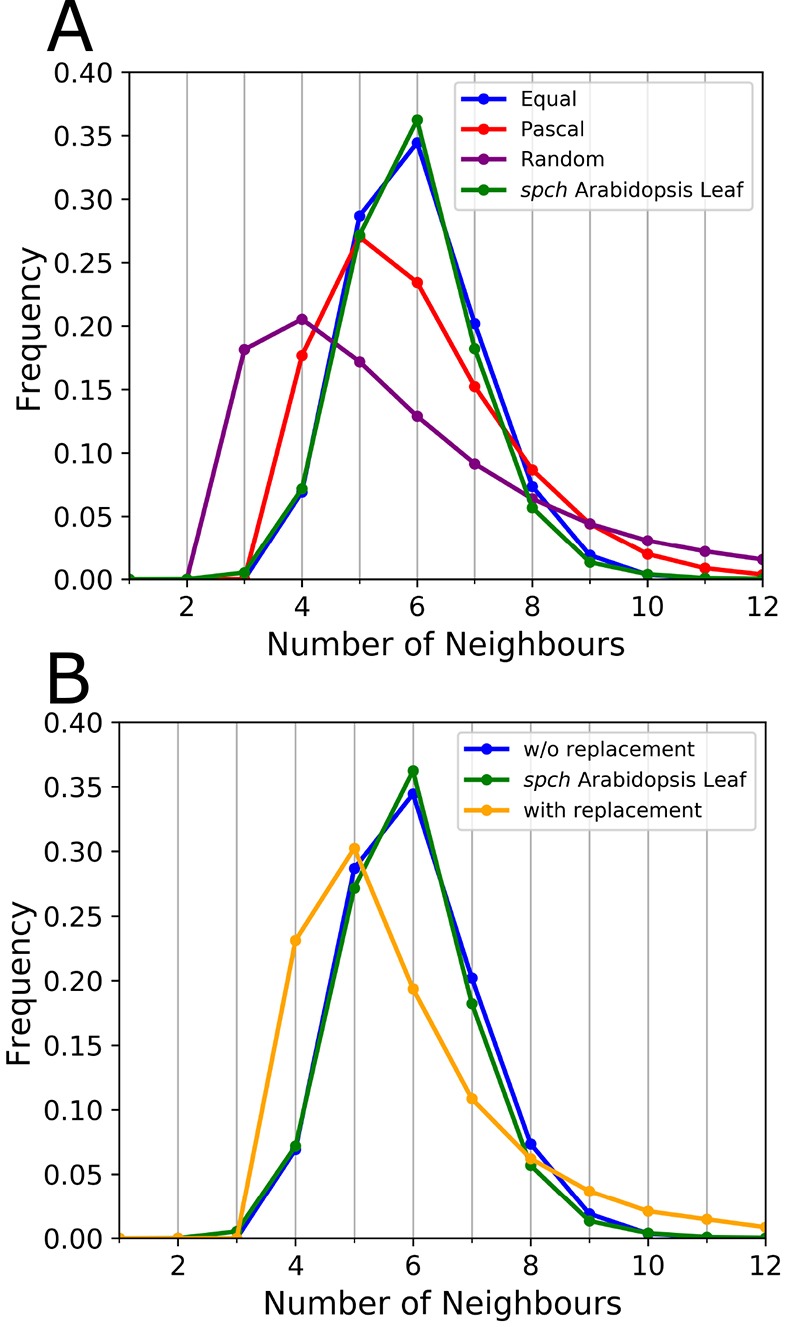
Fig. 5.

Topological distributions resulting from underlying rules. (A) Frequency distributions resulting from the different division rules compared to the aggregated Arabidopsis PC tissue data, using the ‘without replacement’ implementation. The mean and the variance, μ2=< n2>−<n>2, of these distributions are μ1=5.999, μ2=1.312 (Equal:blue); μ1=5.999, μ2=2.695 (Pascal:red); μ1=5.999, μ2=10.334 (Random:purple). (B) Distributions resulting from ‘with replacement’ (yellow) and ‘without replacement’ (blue) implementations, compared with aggregate Arabidopsis data, both using the ‘Equal split’ rule.
