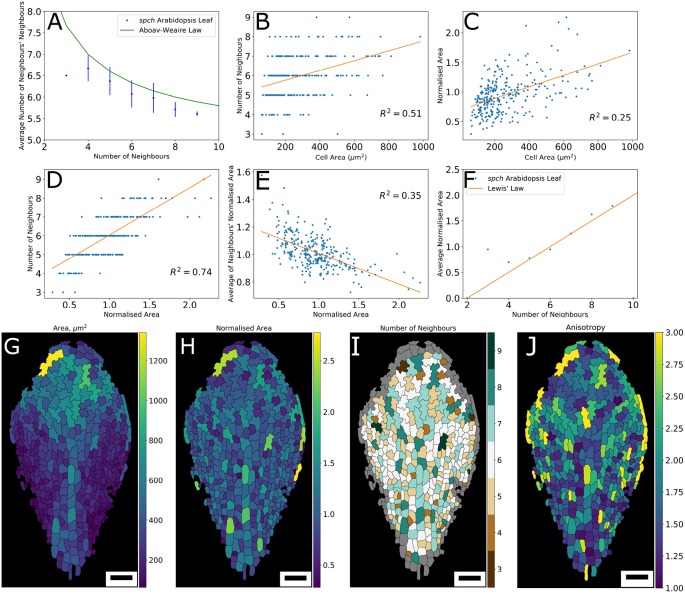
Fig. 7.
Relating topology and size. (A-F) Plots linking topological relationships and cell size for cells of a leaf imaged 220.42 HAS. (A) Number of neighbours versus average number of neighbours' neighbours, with Aboav-Weaire's Law superimposed (green line). (B) Cell area versus number of neighbours. (C) Cell area versus normalised area (cell area/average of neighbours' cell area). (D) Normalised area versus number of neighbours. (E) Normalised area versus average of normalised area of neighbours (excluding the central cell itself). (F) Average normalised area of cells with n neighbours against neighbour number, with Lewis' Law superimposed (orange line). (G-J) Heat maps of cell shape properties over the leaf, showing (G) cell area; (H) cell area normalised to average of neighbours; (I) number of neighbours; and (J) anisotropy (major axis/minor axis). Colour bar shown on the right of each image indicates respective cell-level quantities. Linear regression line shown in orange (B-E), with corresponding R2 value indicated within each panel. Scale bars: 50 µm in G-J.

