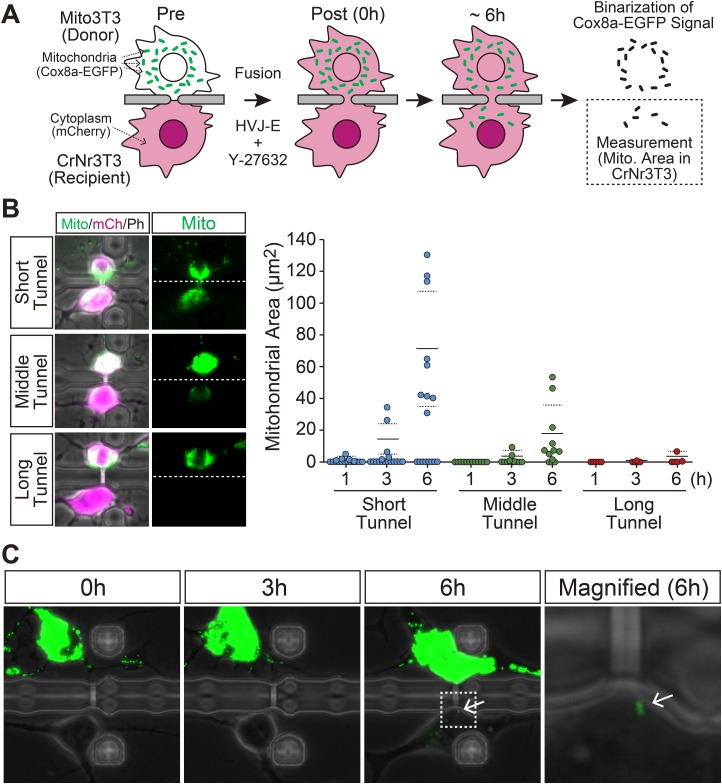
Fig. 3.
Quantitative control of mitochondria transfer by modulating the length of the strictured cytoplasmic connection. (A) Schematic illustration of the experimental procedure. Cell fusion was induced between Mito3T3 and CrNr3T3 cells through a microtunnel by exposure to fusion medium with 160 μM Y-27632 for 1 h. After detection of cell fusion by the transfer of mCherry from CrNr3T3 to Mito3T3 cells, the cells were incubated for 6 h without medium change. The quantity of transferred mitochondria was evaluated by measuring the Cox8a-EGFP signal area in a CrNr3T3 cell. (B) Mitochondria transfer between cell pairs fused through a microtunnel of different lengths. Left panels: examples of cell pairs fused through a long, middle or short tunnel. Dashed lines represent the location of separation wall of CPS. Cox8a-EGFP (Mito: mitochondria), mCherry (mCh: cytoplasm) and phase contrast (Ph) images are shown in green, magenta and gray, respectively. Right graph: the result of image-based quantification of transferred mitochondria. Each plot represents data from one fused pair. Same cell pairs were observed at 1, 3 and 6 h after cell fusion. Horizontal solid and dashed lines represent average values and ±s.d., respectively, those which were evaluated from the data excluding non-transferred cell pairs. (C) Timelapse observation of the cell pair fused through a long tunnel. Data is from the other set of experiments shown in panel B. Mito3T3 and CrNr3T3 cells were fused through a long tunnel by exposure to fusion medium with 160 μM Y-27632 for 3 h, then the medium was replaced with culture medium and incubated for 6 h. Arrows indicate the transferred single mitochondrion. The region of the white box is magnified in the right panel. Cox8a-EGFP (mitochondria) and phase contrast images are shown in green and gray, respectively.

