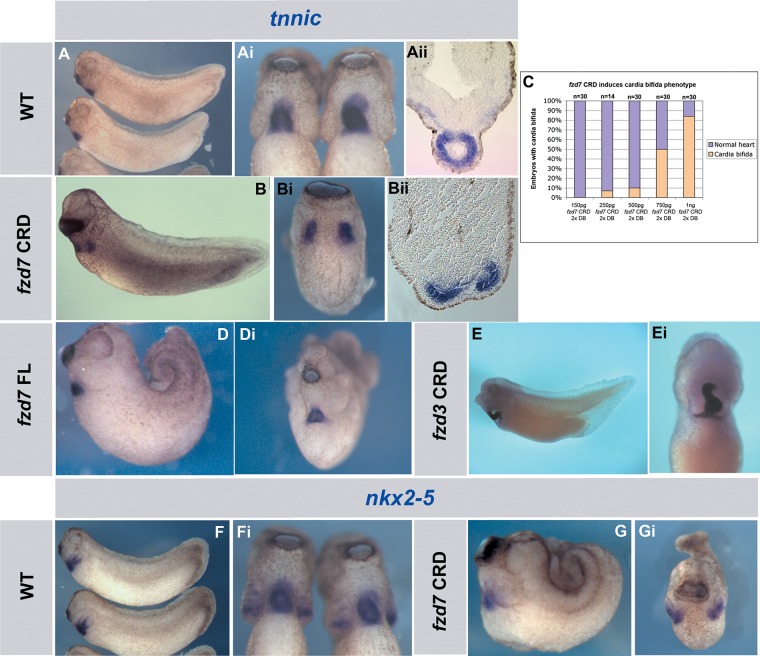
Fig. 4.
A dominant-negative fzd7 induces cardia bifida phenotype. (A,Ai,F,Fi) Lateral and ventral views of wild-type embryos at stage 29 showing normal tnnic (A, Ai) and nkx2-5 (F-Fi) expression in the heart. (B,Bi,G,Gi) Lateral and ventral views of embryos injected in the DB at 4-cell stage with dominant-negative fzd7 (fzd7 CRD). The cardia bifida phenotype is shown by tnnic (B,Bi) and nkx2-5 (G,Gi) expression. These embryos were fixed at the same stage as the control embryos in A and F. (C) Graph showing fzd7 CRD cardia bifida phenotype percentages indicated by tnnic expression. (D,Di) Lateral and ventral views of embryos injected in the DB at 4-cell stage with full-length of fzd7 (fzd7 FL) showing normal heart tube. Note that embryos in D and G are showing severe convergent extension defects but cardia bifida phenotype is only induced by fzd7 CRD. (E,Ei) Lateral and ventral views of injected embryo in the DB at 4-cell stage with fzd3 dominant-negative form (fzd3 CRD) showing normal heart looping at stage 38 indicating that fzd7 CRD cardia bifida phenotype is specific to fzd7. Magnification 20×.

