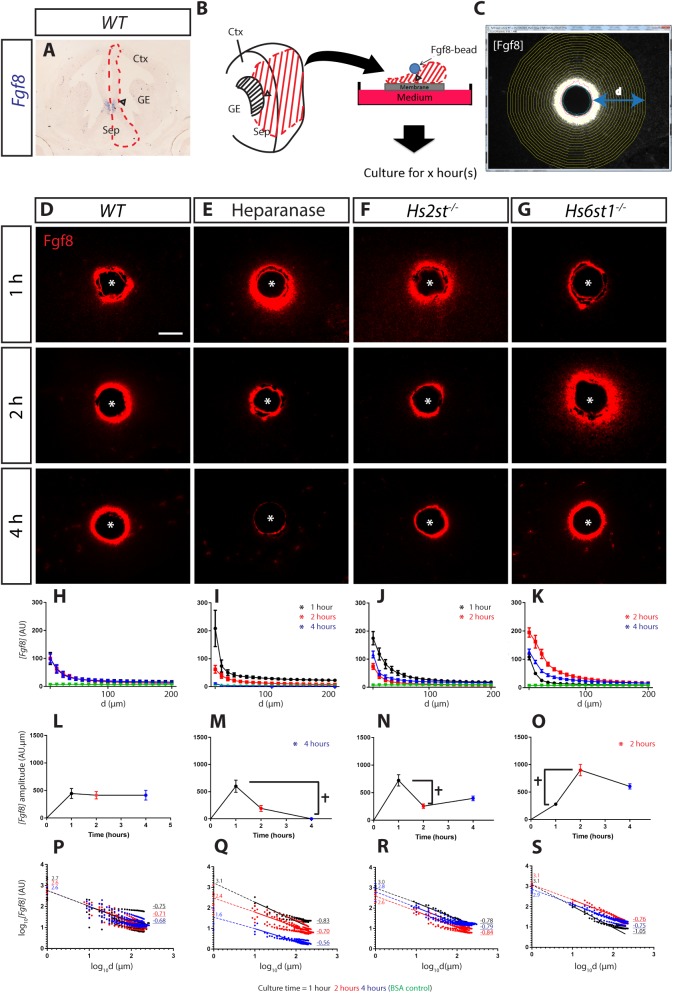
Fig. 1.
Differential HS sulphation regulates [Fgf8] gradient formation with differential kinetics. (A) Fgf8 mRNA is located at the CSB angle (arrowhead). This image is also shown enlarged in Fig. 3C. Sep, septum; Ctx, cortex; GE, ganglionic eminences. (B) Schematic of ex vivo explant culture with Fgf8-infused bead implanted at the CSB angle (arrowhead). (C) Fgf8 immunofluorescence (here shown as greyscale) illustrating concentric rings (yellow) used to quantify [Fgf8] at increasing distance (d) from the Fgf8-bead edge. (D-G) Representative images of Fgf8 immunofluorescence (red) in sections though cultured explants under different conditions and time-points indicated next to panels, asterisk marks bead centre. (H-K) [Fgf8] gradient up to 200 µm from the bead. Data for 1, 2, and 4 h time-points coloured black, red, and blue respectively with BSA control data coloured green, asterisks indicate significant difference between each particular condition with its corresponding WT (Kolmogorov–Smirnov test; P<0.05 following a Bonferroni correction for multiple pairwise comparisons). (L-O) Total Fgf8 level within 200 µm of the bead. Cross indicates significant differences between bracketed time-points within a culture condition indicating fluctuating amplitude through time, while asterisks indicate significant difference at a particular time-point between each particular condition and WT (two-way ANOVA followed by Holm-Sidak post hoc test; P<0.05). (P-S) Fitted curve of H-I in log10[Fgf8] vs. log10[d]. Each plot shows all data points and average line of best fit (solid line) with dotted line indicating extrapolation to log10[Fgf8] axis with numbers on indicating intercept and underlined numbers the slope. Number of explants analysed (N): WT, 8; Heparanase, 5; Hs2st−/−, 5; Hs6st1−/−, 4. Scale bar in D applies to D-G: 100 µm. In H-S values are shown as mean±s.e.m.

