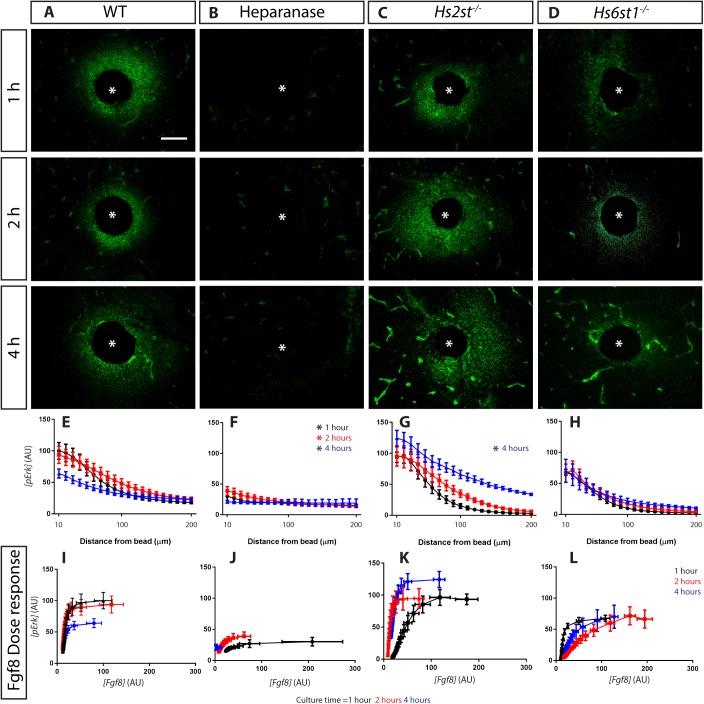
Fig. 2.
Differential HS sulphation differentially regulate Erk response to Fgf8. (A-D) Representative images of pErk immunofluorescence in sections though cultured explants representing different conditions and time-points indicated on panels, asterisk marks bead centre. (E-H) [pErk] gradient formed at different time points up to 200 µm from the bead. Asterisks indicate significant difference between each particular condition with its corresponding WT [Kolmogorov–Smirnov test (P<0.05) following a Bonferroni correction for multiple pairwise comparisons]. (I-L) [Fgf8]/[pErk] dose response curves. Number of explants analysed: WT, 8; Heparanase, 5; Hs2st−/−, 5; Hs6st1−/−, 4. Data for 1, 2, and 4 h time-points coloured black, red, and blue respectively. Scale bar in D applies to A-D: 100 µm. In E-L values are shown as mean±s.e.m.

