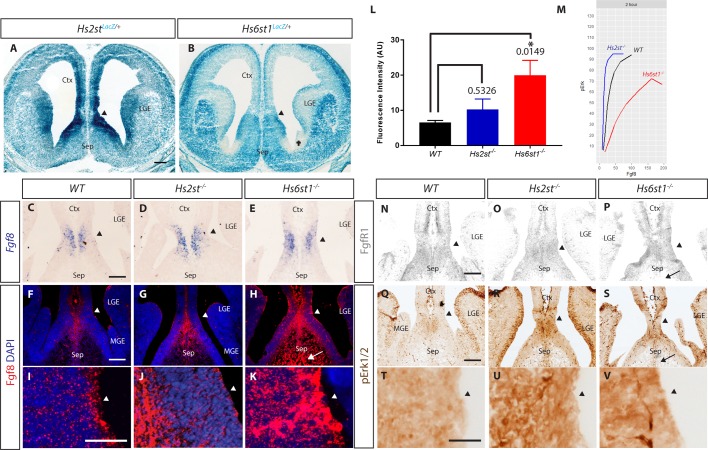
Fig. 3.
Analysis of Fgf8/Erk signalling components in the CSB region of E14.5. WT, Hs2st−/−, and Hs6st1−/− embryos show correlation to Hs2st and Hs6st1 action ex vivo. (A) Hs2st and (B) Hs6st1 expression visualized by LacZ staining of Hs2stLacZ/+ and Hs6st1LacZ/+ sections, respectively. Cross marks an area with very low Hs6st1LacZ expression, N=4. (C-E) Fgf8 mRNA expression. N=5. Note that the image in C is an enlargement of that shown in Fig. 1A. (F-H) Fgf8 protein expression. N=3. (I-K) Higher magnification of VZ angle in F-H. (L) Quantification of Fgf8 fluorescent intensities in I-K. P values are as depicted on graph. Error bars indicate standard error of mean. (M) Dose response of WT, Hs2st−/−, Hs6st1−/− tissue showing increased sensitivity to Fgf8 in Hs2st−/− while Hs6st1−/− tissue have decreased sensitivity to Fgf8 when compared to WT tissue. (N,O) Expression of Fgfr1 protein. N=4 for WT, N=3 for Hs2st−/− and Hs6st1−/−. (Q-S) pErk protein expression. N=3. (T-V) Higher magnification of ventricular zone in Q-S. In A, B, C-K and N-V arrowheads indicate apical surface of the ventricular zone at the CSB angle; arrows in H, P, S indicate Fgf8High, Fgfr1Low, pErkLow septal area in Hs6st1−/− embryos. N=3. Ctx, cortex; LGE, lateral ganglionic eminence; MGE, medial ganglionic eminence; Sep, septum. Scale bars: A applies also to B: 200 µm; C applies to C-E: 100 µm; F applies to F-H: 100 µm; I applies to I-K: 100 µm; N applies to N-P: 100 µm; and Q applies to Q-S: 100 µm; T applies to T-V: 100 µm.

