Fig. 2.
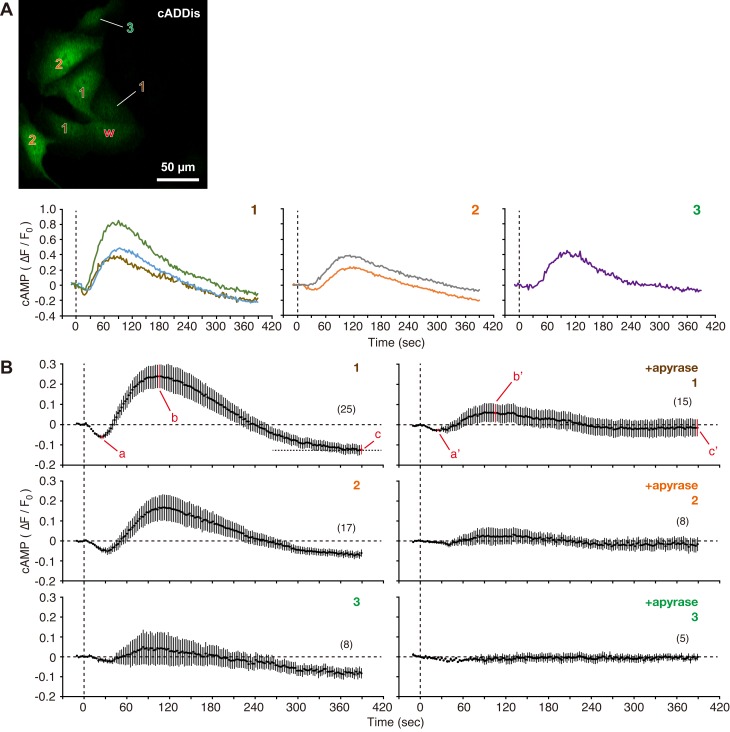
Cell membrane disruption stimulates cAMP production in neighboring cells. (A) ‘w’ in the fluorescence image of MDCK cells expressing Green Upward cADDis indicates a wounded cell. Cells adjacent to the wounded cell were labeled with numbers in order of their proximity to the wounded cell. A cell was wounded at time zero with a glass needle in 1.8 mM Ca2+ Ringer's solution, and the time course of changes in fluorescence intensity of cADDis was plotted for neighboring cells (1–3). The image shown in this figure was acquired 90 s after cell membrane disruption. See also Movie 1. (B) Cells were wounded at time zero with a glass needle in the absence or presence of 20 U/ml apyrase, and changes in fluorescence intensity in neighboring cells were compared. The number of observed cells is indicated in parentheses. P=0.0007 (a–a′); P=0.0427 (b–b′); P=0.0197 (c–c′).

