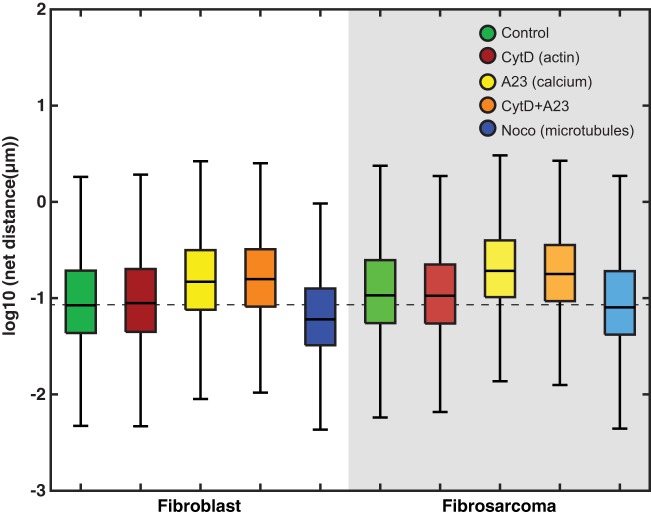
Fig. 1.
Box plots showing net movement data from all groups. Whiskers extend to 10th and 90th percentiles of data. The median of the control group is extended throughout the plot as a dashed line. Within the fibroblast group, cells exposed to both A23 and A23+CytD exhibited greater net movement when compared to both control and CytD-treated cells. In the fibroblasts exposed to noco, the mitochondria exhibited overall decreased net movement compared to all other conditions. Within the fibrosarcoma group, mitochondria exposed to A23 and A23+CytD exhibited greater net movement when compared to both fibroblast and fibrosarcoma controls.

