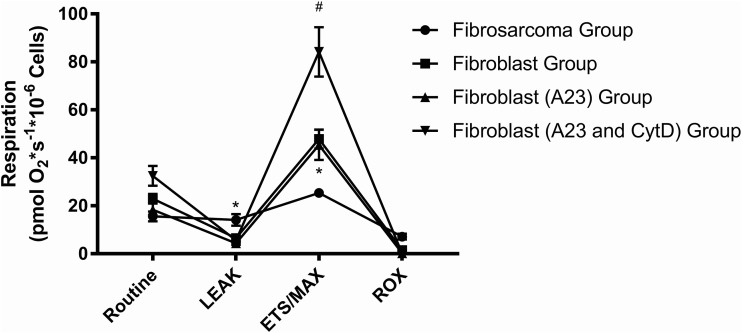
Fig. 4.
Respiration in intact cells: cellular mitochondrial respiration obtained in the four groups in key parameters of mitochondrial respiration. Data are mean±s.e.m. The sarcoma group exhibited higher LEAK state and lower MAX/ETS or uncoupled respiration when compared to the other groups (*P<0.001 for both). The fibroblast (A23 and CytD) group exhibited significantly higher ETS/MAX compared to the other three groups (#P<0.0001). There were no differences in ROX between the groups. The key parameters in respiration are explained in the Materials and Methods.

