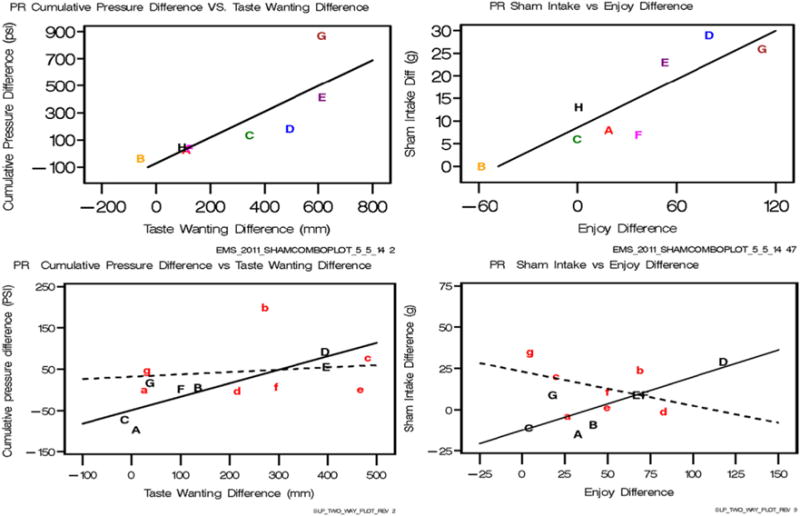
Fig. 3.

Left: Regressions on the PR schedule of differences between sweet and non-sweet fluids in pressure exerted between reinforcements predicted from differences between sweet and non-sweet fluids in amount wanted during the taste test before the trial, for Experiment 2 (top row) and Experiment 3 (bottom row). Right: Regressions of differences in sham-intakes between sweet and non-sweet fluids predicted from differences in hedonic (“how much did you enjoy”) ratings between sweet and non-sweet beverage after consuming it during the test for Experiment 2 (top row) and Experiment 3 (bottom row) Parameters of the lines for Experiment 2 are shown in lines 1 and 2 of Table 6 and for Experiment 3 lines 1 and 4 Table 10. Each letter shows an individual participant so that responses of the same participants across variables can be compared. Note in Experiment 2, that one participant (“B”) wanted more of the non-sweet than sweet and this reversal of the expected difference (i.e. sweet < non-sweet) was also seen on the predicted variables. For Experiment 3 (bottom row) the dotted line, lower case letters is for short sleep and the solid line, uppercase letters for habitual sleep.
