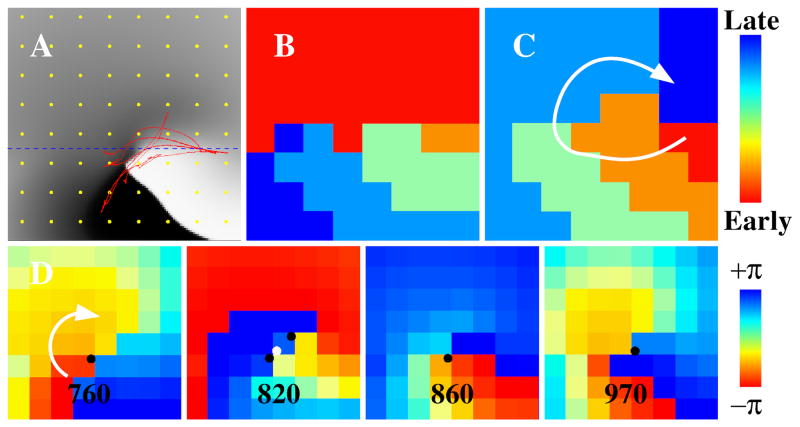
Figure 6. Importance of selection of time window for analysis in computer simulation.
(A) Snapshot of a computer simulation of a spiral wave and a meandering tip trajectory in red. Tissue is heterogeneous with a larger (smaller) conductivity above (below) the dashed line. Membrane potential is indicated using a gray scale with activated/deactivated tissue shown in white/black. (B) Isochronal map using activation times on the 8×8 grid shown in yellow in (A). No rotation is seen. (C) As in (B) using a time window shifted by 50ms. Rotation is identified. (D) Phase maps spanning the time interval of (B) using the activation times of the grid, with phase singularities shown as black (clockwise rotations) or white (counter-clockwise rotations) symbols.

