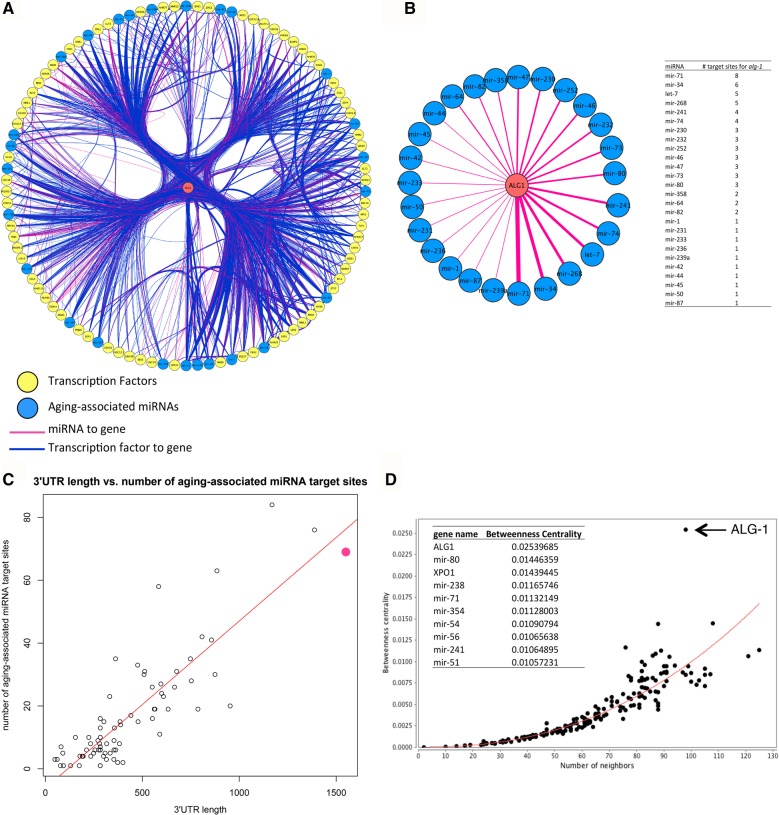
FIGURE 1.
alg-1 is an important node in the regulatory gene network during aging. (A) alg-1 and its first neighbors, ordered by highest connectivity (number of unique edges) from 6 o'clock counterclockwise. alg-1 is shown in the center in red. Seventy-two TFs and 26 miRNAs target alg-1. (Yellow nodes) TFs; (blue nodes) aging-associated miRNAs; (pink edges) miRNA-to-gene regulation; (blue edges) TF-to-gene regulation. (B) alg-1 is targeted by 26 different miRNAs through a total of 69 sites. (Left) Edge width reflects the number of target sites for each miRNA in the alg-1 3′ UTR. Nodes ordered by the number of target sites, as in A. (Right) Numeric representation of graphical data on left. (C) 3′ UTR length versus the number of aging-associated miRNA target sites. MiRNA target site numbers retrieved from mirWIP (Hammell et al. 2008). alg-1 is shown by the pink dot. (Red line) Linear fit. (D) Betweenness centrality distribution of nodes. The table (inset) shows the top 10 genes by betweenness centrality index. (Red line) Power-law fit. See also Supplemental Figure S1 and Supplemental Tables S1–S3.

