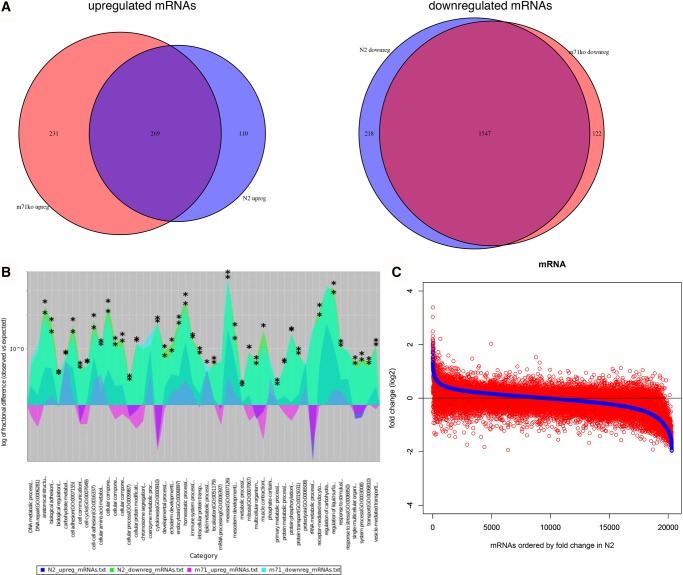
FIGURE 4.
mRNA expression is dysregulated in aging mir-71(n4115) animals. (A) Comparisons of differentially expressed mRNAs during aging between N2 wild-type (blue) and mir-71(n4115) (red) (P < 0.01). (Left) Venn diagram of up-regulated genes during aging. (Right) Venn diagram of down-regulated genes during aging. (B) Enriched GO terms for differentially expressed genes during aging. Overlay of GO terms for genes up-regulated in N2 (dark blue), genes down-regulated in N2 (green), genes up-regulated in mir-71(n4115) (magenta), and genes down-regulated in mir-71(n4115) (cyan). Y-axis is the log of fractional difference between observed numbers of genes vs. expected numbers of genes. Positive values indicate enrichment and negative values indicate depletion. Statistically significant enrichment of GO term in a given experimental condition indicated by asterisk (*) (hypergeometric test, Benjamini–Hochberg adjusted P < 0.001). Image generated in PANTHER (Mi et al. 2013). (C) Adapted waterfall plot of mRNA expression fold change during aging in N2 wild-type (blue) versus mir-71(n4115) (red). Genes ordered from left to right by magnitude of expression fold change (most positive to most negative) in N2. Corresponding genes are shown in the overlapping position. See also Supplemental Tables S7 and S8.

