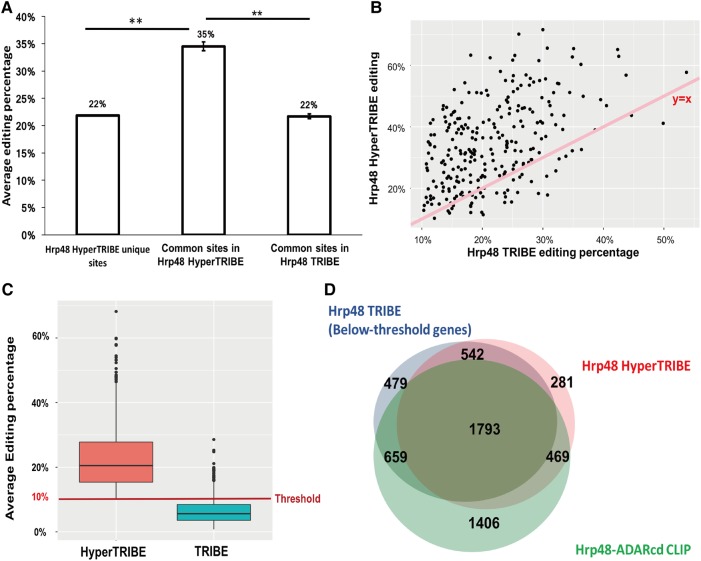
FIGURE 3.
HyperTRIBE increases the editing frequency, which allows the detection of many below-threshold TRIBE sites. (A) Bar graph shows the editing percentage of the sites uniquely identified in HyperTRIBE as well as the editing percentage of the common editing sites in HyperTRIBE and in TRIBE, respectively. Editing percentage is shown as the weighted average. The editing percentage of the sites commonly identified by TRIBE and HyperTRIBE is increased in HyperTRIBE (Student t-test performed, [**] P < 0.0001). (B) An increase in editing percentage by HyperTRIBE is observed for most sites. A scatter plot shows editing percentage of HyperTRIBE editing sites (y-axis) and TRIBE editing sites (x-axis). Sites identified by both TRIBE and HyperTRIBE are shown. Line that represents y = x is shown for reference (pink). (C) About 30% of the 4017 below-threshold sites in TRIBE show an elevated editing percentage in HyperTRIBE, allowing them to be identified in the analysis pipeline (Z-test performed to test enrichment, P ≈ 0). HyperTRIBE editing sites that are present in TRIBE but below the 10% threshold are shown. Some below-threshold TRIBE editing sites have >10% average editing percentage because one replicate has >10% editing but the other replicate has <10%. A red line indicating 10% threshold is shown for reference. (D) Of note, 67% and 71% of TRIBE below-threshold target genes overlap with HyperTRIBE and CLIP respectively. Venn diagram shows the overlap of genes edited below-threshold by TRIBE (3473 in total, blue), genes identified by HyperTRIBE (3085 in total, pink), and Hrp48-ADARcd CLIP genes (4327 in total, green) (McMahon et al. 2016). Although small, the difference in overlap between below-threshold TRIBE genes and CLIP (71%) versus overlap between HyperTRIBE genes and CLIP (73%) is significant (Z-test performed, P = 0.015).

