FIGURE 1.
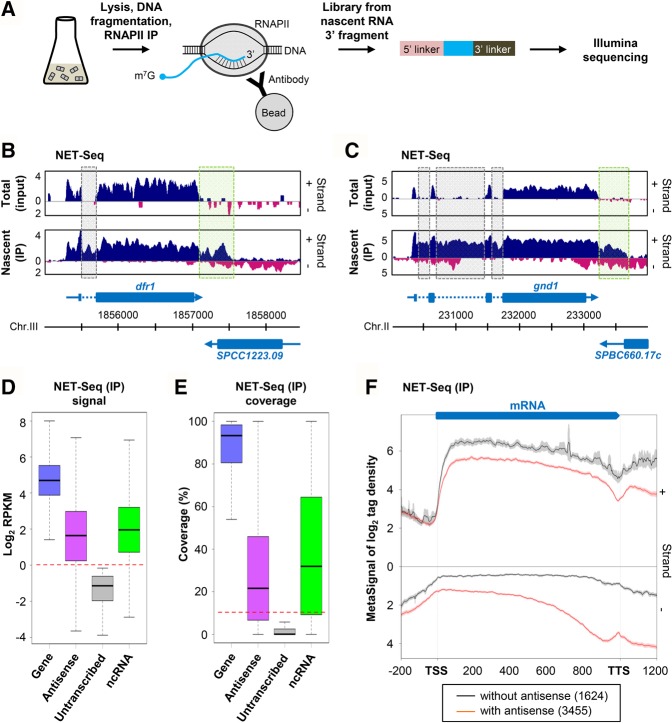
Extensive antisense transcription in fission yeast. (A) Overview of NET-seq. Biological duplicates of WT (YAM2492) cells were grown to mid-log phase in rich (YES) medium. After cells’ lysis and DNA fragmentation, ternary RNAPII/DNA/RNA complexes were purified. Strand-specific libraries were then constructed from nascent RNAs 3′ fragments. (B,C) Snapshots of total RNA (input) and nascent transcript (IP) signals along the dfr1 (B) and gnd1 (C) genes in WT cells. In each panel, the signal corresponding to the + and − strand is shown in blue and pink, respectively. Blue arrow, dashed line, and box represent the mRNA, intron, and coding sequences, respectively. Introns and the region downstream from the polyadenylation site of dfr1 and gnd1 are highlighted using dashed gray and green boxes, respectively. The snapshot was produced using VING (Descrimes et al. 2015). (D) Box-plot of nascent transcript signal (RPKM, log2) in WT cells for transcribed (RPKM >1, blue) or untranscribed (RPKM <1, gray) protein-coding genes, for their antisense (magenta) and for annotated ncRNAs (green). This set corresponds to the 1522 ncRNAs from the current version of Pombase, plus 487 novel ncTU (Eser et al. 2016). The red dashed line indicates the threshold (RPKM >1). (E) Box-plot of coverage by nascent transcript reads. Coverage corresponds to the percentage of nucleotides of each element covered by ≥1 uniquely mapped reads, in each of the two biological replicates of the WT strain. The red dashed line indicates the threshold (10%). (F) Metagene view of genes with (red lines) or without (black dashed lines) antisense transcription. For each group, normalized coverage (tag/nt, log2) along sense (+) and antisense (−) strands were piled up in a strand-specific manner, and the average signal for each strand was plotted. TSS and TTS correspond to gene (mRNA) transcription start site and transcription termination site, respectively. Note that the TSS to TTS region was first scaled to 1000 (virtual) nt, and the signal associated to each nucleotide was scaled upon polynomial interpolation, as previously described (Sinturel et al. 2015). The shading surrounding each line denotes the 95% confidence interval.

