FIGURE 3.
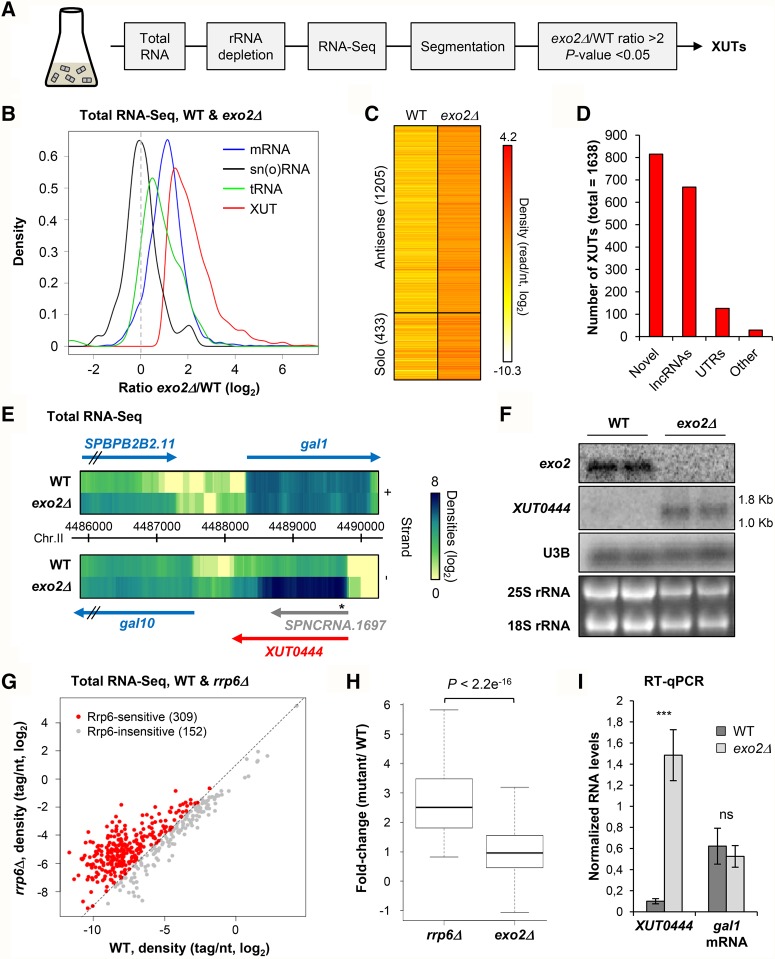
XUT lncRNAs landscape in fission yeast. (A) Experimental strategy overview. Total RNA was extracted from exponentially growing YAM2394 (WT) or YAM2397 (exo2Δ) cells. After rRNA depletion, strand-specific libraries were constructed and sequenced. Segmentation was performed from uniquely mapped reads. XUTs were identified as segments showing no overlap with ORF, an exo2Δ/WT ratio >2, and an adjusted P < 0.05 upon differential expression analysis. (B) Density plot of exo2Δ/WT signal ratio for mRNAs (blue), sn(o)RNAs (black), tRNAs (green), and XUTs (red) upon normalization on sn(o)RNAs. (C) Total RNA-seq signal for XUTs in WT and exo2Δ are shown as a heatmap. The number of antisense and solo XUTs is indicated. (D) Overlap (≥1 nt) between XUTs, previously annotated lncRNAs, UTRs, and other elements (pseudogenes, tRNAs). (E) Snapshot of total RNA-seq signal along gal1 in WT and exo2Δ cells. Signal for the + and − strands are visualized as heatmaps in the upper and lower panels, respectively, using the VING software (Descrimes et al. 2015). The star indicates the position of the probe used to detect XUT0444 in Fig. 3F. (F) Northern blot detection of XUT0444 (antisense to gal1). Transcripts were detected from total RNA extracted from biological duplicates of YAM2394 (WT) and YAM2397 (exo2Δ) cells, using 32P-labeled oligonucleotides (listed in Supplemental Table S1). Levels of the 18S and 25S rRNAs are visualized from ethidium bromide staining of the gel. Size of the RNA ladder bands is indicated on the side of the XUT0444 panel. XUT0444 predicted size is 1.7 kb. (G) Identification of putative Rrp6-sensitive aslncRNAs. The RNA-seq signal antisense to the 461 genes with antisense transcription but no convergent TU or no annotated aslncRNA/asXUT was computed from previously published total RNA-seq data, obtained from WT and rrp6Δ cells (Zhou et al. 2015). Data are presented as a scatter plot of tag densities (log2 scale), computed using uniquely mapped reads. The 309 putative Rrp6-sensitive aslncRNAs (rrp6Δ/WT ratio >2) are highlighted in red. The black dashed line indicates a twofold increase. (H) Box-plot of the rrp6Δ/WT and exo2Δ/WT ratios for the 309 putative Rrp6-sensitive antisense transcripts. The P-value obtained upon Wilcoxon rank-sum test is indicated. (I) RT-qPCR analysis of XUT0444 and gal1 mRNA levels in WT and exo2Δ cells. Strains YAM2400 (WT) and YAM2402 (exo2Δ) were grown in rich YES medium to mid-log phase. Levels of XUT0444 and gal1 mRNA were determined by strand-specific RT-qPCR from total RNA and normalized on U3B snoRNA level. Data are presented as mean ± standard deviation (SD), calculated from three biological replicates. (***) P < 0.001 upon t-test; ns, not significant.

