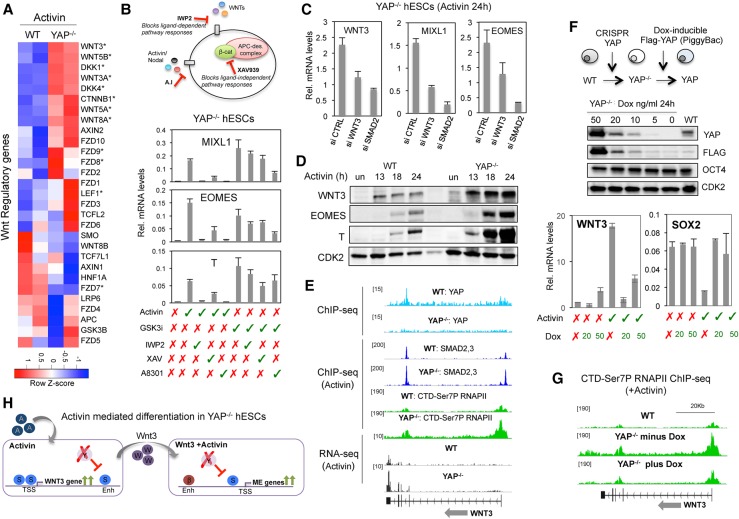
Figure 5.
YAP repression of WNT3 prevents premature differentiation in response to Activin. (A) Heat map showing expression levels of Wnt regulatory genes in wild-type and YAP knockout cells following treatment with Activin. (B) Diagram showing the mechanism of action of the Wnt inhibitors IWP2 and XAV and the Activin inhibitor A8301. The graphs show qPCR analysis of the indicated genes in YAP knockout hESCs treated with the specific compounds, as listed below the graphs. Mean (SD). n = 3. (C) YAP knockout hESCs were transfected with siRNAs against Wnt3 or SMAD2, and expression levels of the WNT3, EOMES, and MIXL1 genes were analyzed by qPCR. Mean (SD). n = 2. (D) Immunoblot showing expression levels of WNT3, EOMES, and T proteins after Activin treatment for the indicated times in wild-type and YAP knockout cells. CDK2 was used a loading control. (E) Genome browser captures of ChIP-seq and RNA-seq experiments at the WNT3 gene. Cell lines and immunoprecipitated proteins are indicated above each lane. (F) YAP knockout cells were transfected with the transposon-based vector PiggyBAC containing an intact Flag-YAP cDNA under a doxycycline promoter. The immunoblot shows YAP levels in cells exposed to different levels of doxycycline. The graphs illustrate the inverse correlation of WNT3 and YAP mRNAs in hESCs. Mean (SD). n = 2. (G) Genome browser capture of RNAPII CTD-Ser7P ChIP-seq in Activin-treated wild-type and PiggyYAP cell lines before and after doxycycline treatment. (H) A schematic depiction of the results of the figure. (S) SMAD2,3; (β) β-catenin; (Y) YAP; (enh) enhancer; (TSS) transcriptional start site.

